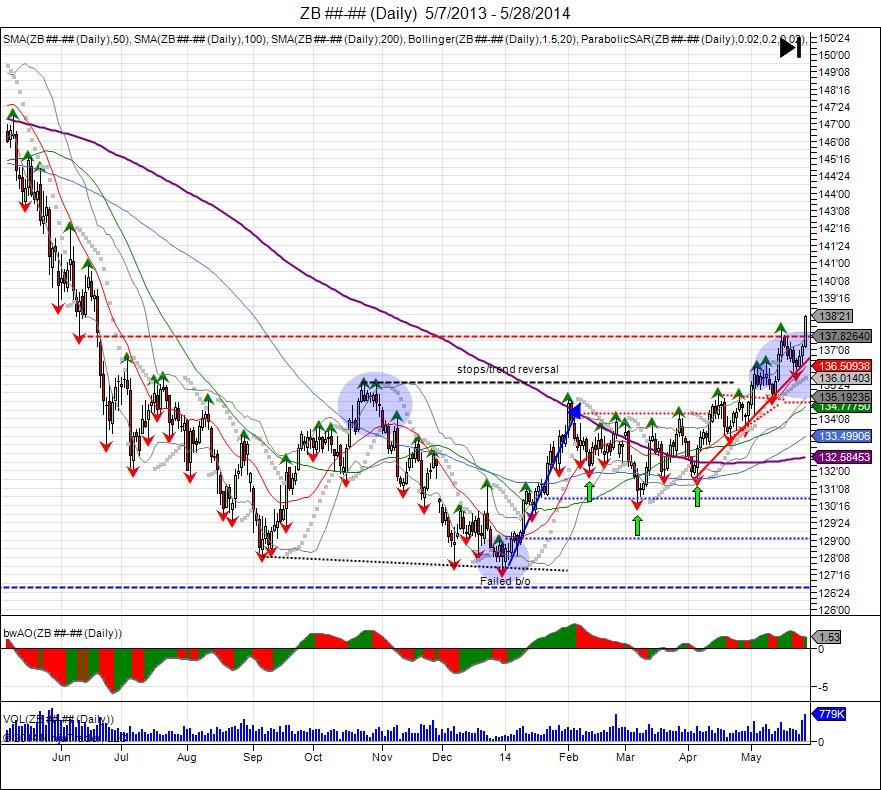
As the NFP rate creeped toward the Fed's 6.5% target, the bond market acted ahead and as it closed 2013 on the lows, it started 2014 on the lows, only to fail in moving lower and squeeze higher during the month of January. This upside reversal caught shorts by surprise as it squeezed the market from 12723 to 13503 to stop against major resistance from October of 2013. The reversal into this resistance squeezed out the short side, however for the next 3 months the bond market stabilized sideways to consolidate the reversal and in turn develop a base or in technical terms an inverted head/shoulder pattern from February to April. With April's low retesting March lows and holding, this saw a push back to breach the 3 month highs and confirm the inverted h/s pattern. The coiled pattern once again left shorts selling the market trapped and with the breakout above the 3 month high, this gave fuel to expand this inverted h/s target and squeeze out October 2013 highs. This was done in May, confirming the lows of 2014 as a failed breakdown and a reversal in trend. So far since the October highs being taken out, this has led the bond market to further squeeze another 4 handles as late buyers now come in after the confirmation and chase the market up. Going forward, major resistance is being tested from June of 2013 in the bond market with new buyers chasing prices above last October's highs. A move through 14028 squeezes this resistance level and retraces the bond market 50% from its 2012 high to its 2014 low. A break below 13606 reverses short term upside momentum to shake out longs chasing the market and give way to test downside support at old resistance 134, followed by 129 as major support off the year lows.

The Yen also started the year on the lows and reversed higher during the first month of 2014. This caught the market off guard again, squeezing out the short side with the move from 9486-9926. Since this January upside squeeze, the Yen, as the bond market, went into a sideways consolidation period as it turned lower, however held above the January lows to keep shorts trapped. The consolidation and coiling led to an inverted head/shoulder pattern just as the bond market, with a squeeze in May to break above the neckline of 9870 and reach its 200day moving average for the first time since November of 2013. In contrast to the bond market, the Yen has had much more difficulty in expanding this range and seeing new buyers chase the market at these levels. For now investors are favoring the hedge of stocks into the bond market. Eventually this should rotate from bonds into yen and gold. Short term, the Yen remains in an uptrend with a target of 10150 to expand its 3 month range. Failure to hold the May low gives way to retest the April lows.
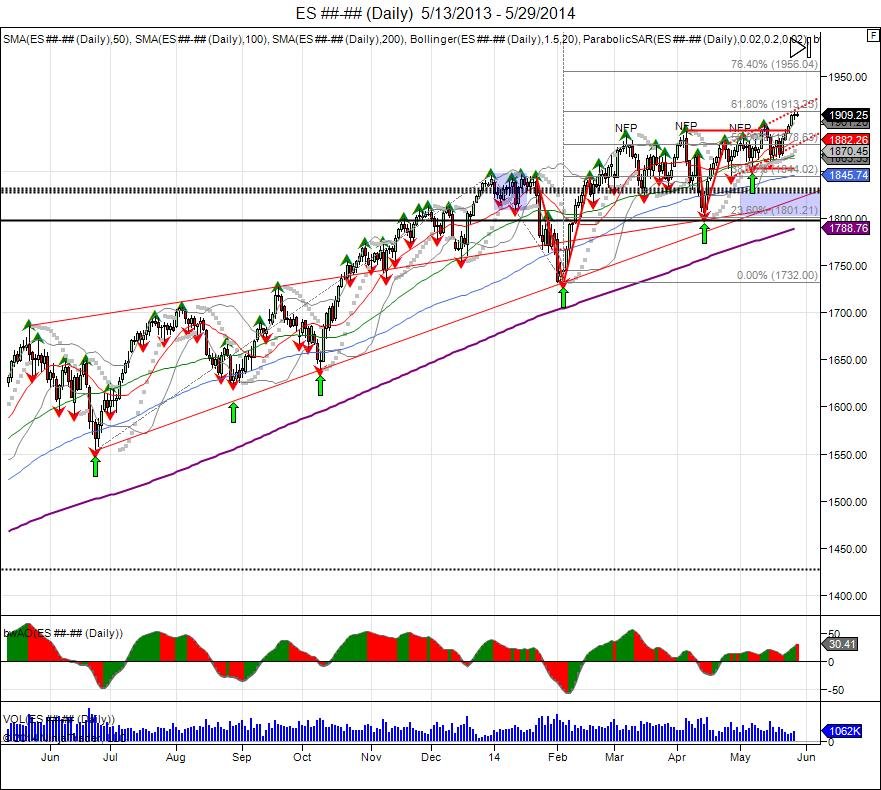
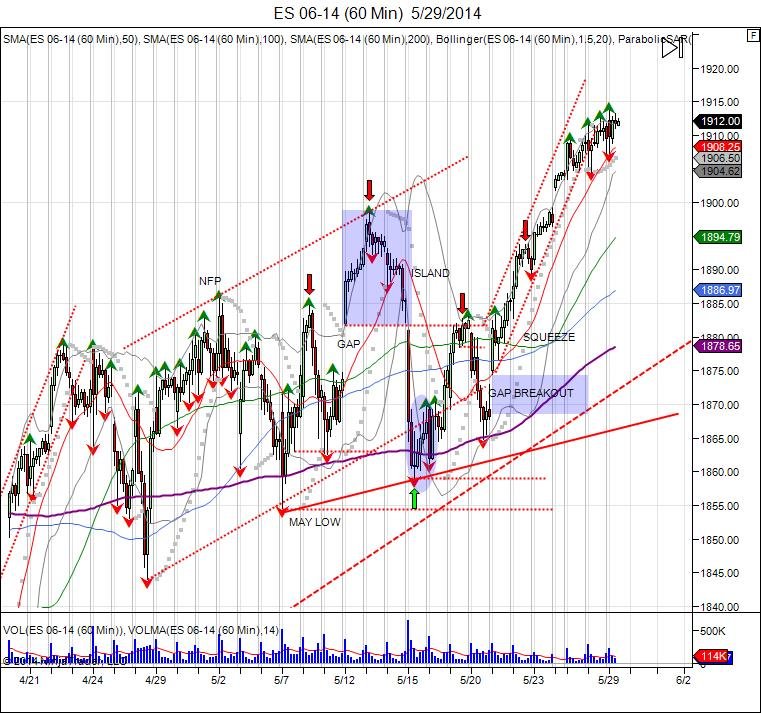
This is the trouble the equity markets has seen in 2014. The 6.5% target reached, then pulled. Bonds, gold, and the yen all reversed in 2014 higher. The equity markets broke early in January, however in contrast to bonds gold and yen, the equity breakdown was unable to sustain and saw a reversal back through the 2013 highs to squeeze out the short side and reverse the downside break. This reversal led into this 3 month consolidation period with the market trading sideways with a range of 189250-180325, in search of new buyers to sustain prices above 1847. Each peak high made during this period was done on the jobs numbers being released and were used to sell into by longs and take profits. This showed profits being taken with the market being slammed down only to hold above 1800 and find new buyers come into support prices. The latest NFP number also saw profit taking into, however was a lower high which gave opportunity for shorts to defend. With shorts failing to breach the late April low, buyers reclaimed the May high done on NFP at 1886, and this has led into a breakout of the 3 month range as shorts are once again being squeezed and the market has broken through 1900. With last year's parabolic breakout above 1440 and move to 184650 to close the year, the biggest corrrection came in May with the market trading down from 168575 to 155325. Since this low, all the corrections have been milder, making higher lows and higher highs, to keep this trend intact. By using this low and extending it to the December high and using the 2014 low of 1732, this has given upside fib extension levels to expand the 2013 rally and head fake in 2014. This upside extension reached 61.8% at 1913 which has led into a small pause as resistance is being met. By taking the late January high of 1844 and low of 1732, this gives a range of 112. With the recovery above 1844 in February, by adding this 112 range to 1844, this gives an upside target of 1956 which coincides with the 76.4% extension level. With only a month left in trading the 1st half of the year, and with the lack of sellers taking control on the downside, this last month is being used to force out the last of these shorts and force a capitulation to the upside, giving way up to 1950 to have shorts through in the towel just before the start of the 2nd half in July. Short term sees new support down to 1889 with sell stops below 1859. The May lows are now a major pivot as a breach of this level gives way to shake out the long side and retest the April lows. Bottom line is the first half of 2014 started shaky in equities and have seen a major period of rotation and consolidation as it witnesses bonds, gold, and the yen see money flow in. This has seen equities lag, and now attempt to catch up as bonds complete their upside objective and gold/yen remain subdued. Summer is turning into a capitulation period with very thin trading. The faster the market can capitulate this move up, the faster it will turn back lower. If you have noticed, the last 3 months has been sideways, however has seen sharp moves down, and sharp moves up. These shake out longs, get people short, squeeze out short, and get people long again. There is a war taking place until this latest breakout that is going for captitulation. The "war" is the distribution period and the FIGHT to hold the 2013 uptrend and higher lows. The opening in July will be the start of a new half and new money flows into the market. The reaction to the first half of July will be the tell for the second half of the year. To receive these vol and pivot levels, be sure to subscribe to CST Pro.
RISK DISCLOSURE: PAST PERFORMANCE IS NOT INDICATIVE OF FUTURE RESULTS. THE RISK OF LOSS IN TRADING FUTURES AND OPTIONS IS SUBSTANTIAL AND SUCH INVESTING IS NOT SUITABLE FOR ALL INVESTORS. AN INVESTOR COULD LOSE MORE THAN THE INITIAL INVESTMENT.