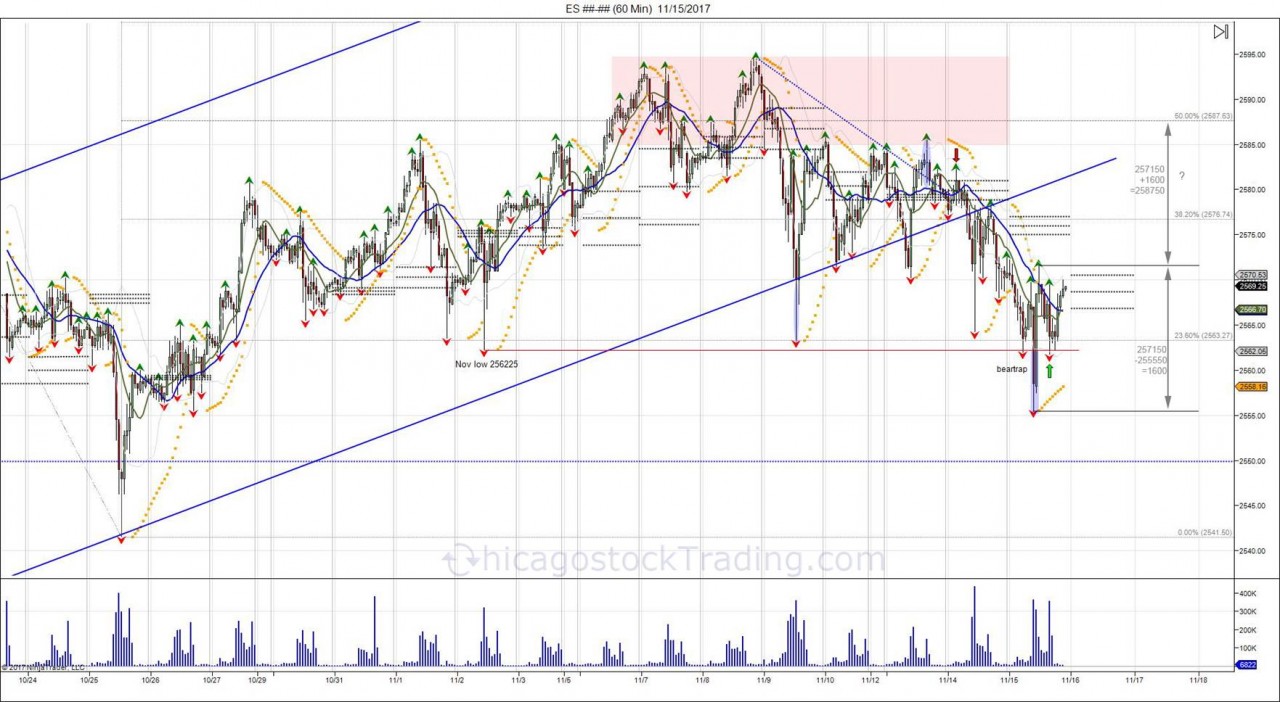
Last week, the market took out the early November low of 256225, falling into 255550, before quickly bouncing back to 257150. This break of the monthly low turned into a failed breakdown and a head fake as the market retested 2562 into the end of day, creating a right shoulder for an inverted head/shoulder pattern. Shorts below 2562 were left trapped, giving opportunity to expand the range up to 257150.
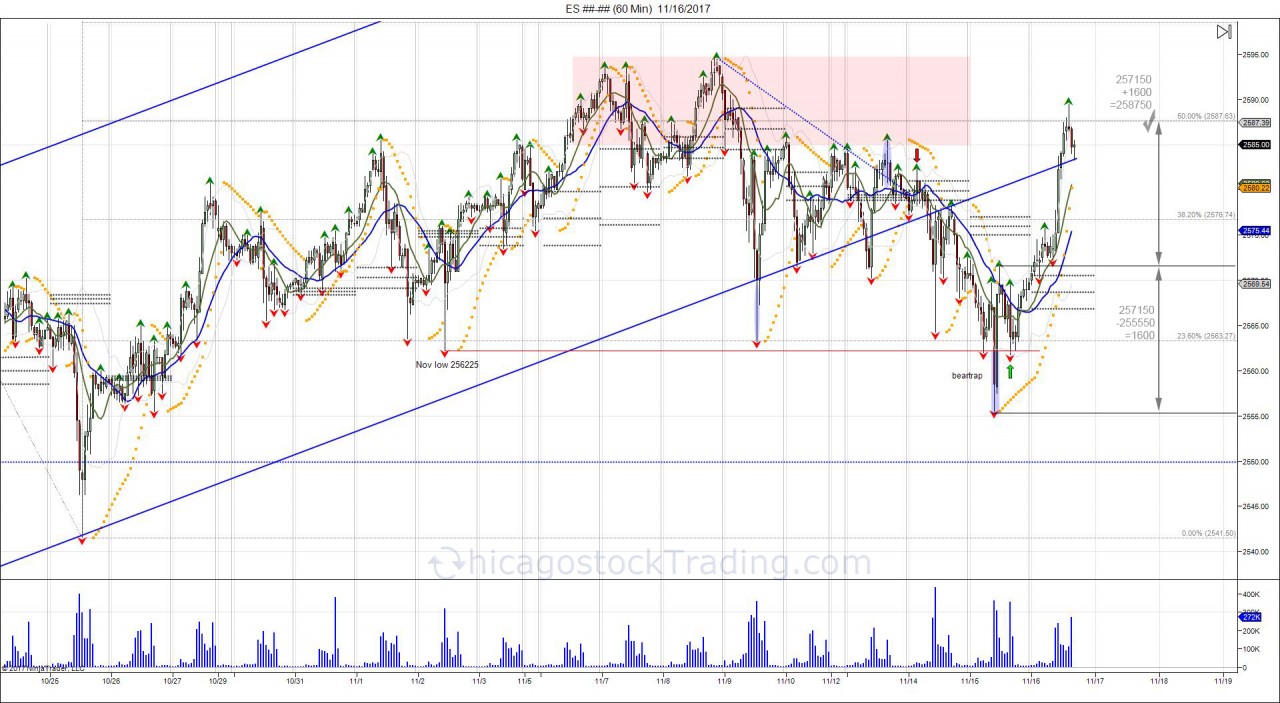
The next day, buyers overcame the 3 day pivot range overnight to setup a higher cash open at 2574, opening 9 higher from the prior close of 2565. This left these shorts trapped and forced buyers to chase, giving way to expand the inverted head/shoulder pattern up to 257150 with a high of 258950.
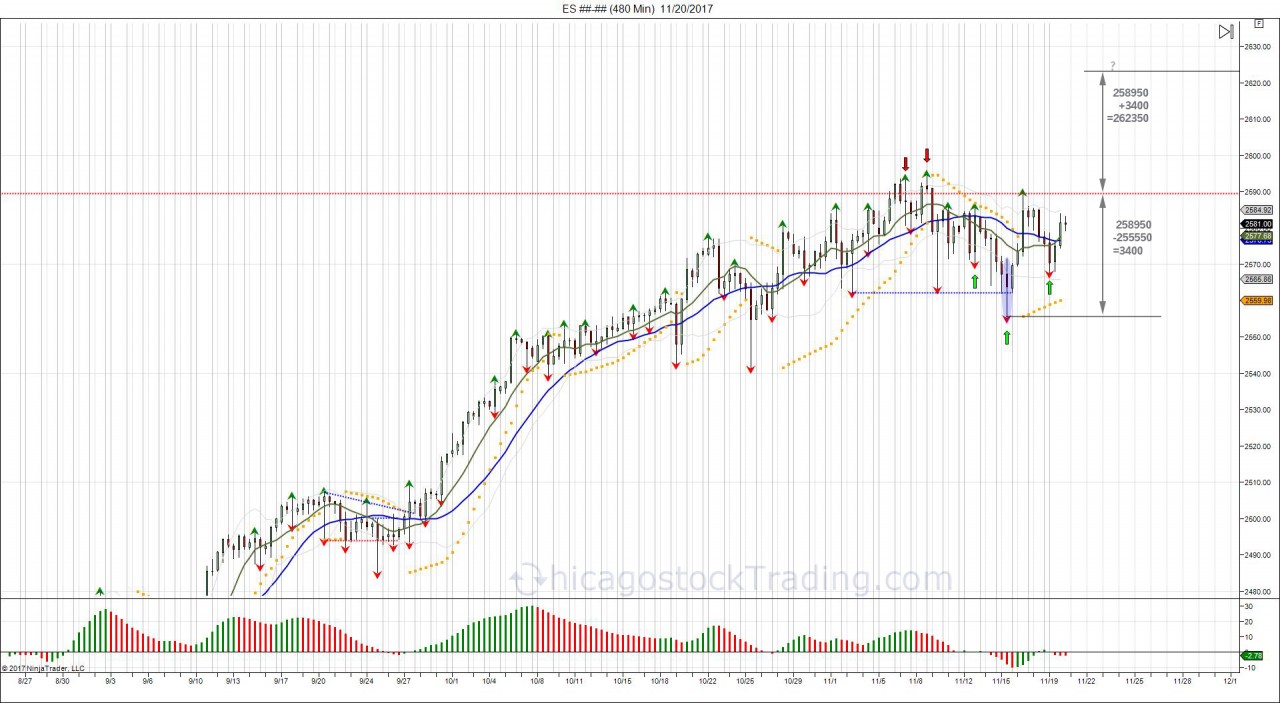
Following the 258950 high, the market retraced back down to retest support off of last week's low, making a Globex low of 256775 Sunday night. This was quickly bought as buyers stepped in to defend the "head fake" below the month low, seeing a bounce back to 2581 which created a right shoulder for a larger head/shoulder pattern within 2589-2555.
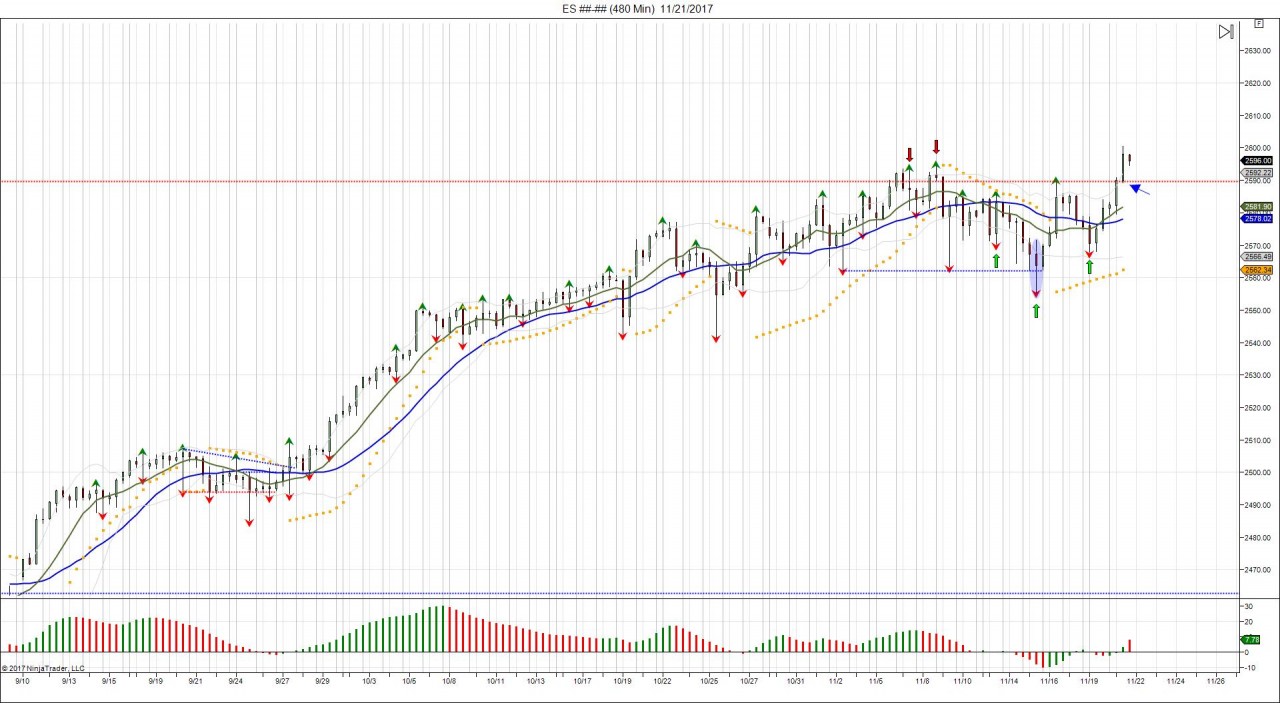
On Tuesday the cash market gapped higher, opening 8 handles above its prior close of 2582 at 2590, putting the squeeze on shorts and once again forcing buyers to chase higher. This gave way to squeeze through the 258950 neckline, confirming the head/shoulder pattern. Going forward, there is room for the head/shoulder range of 34 handles (2589-2555), to be expanded up to 2623. In order to fail, the market must fall back below its neckline and take out its right shoulder low of 256775.
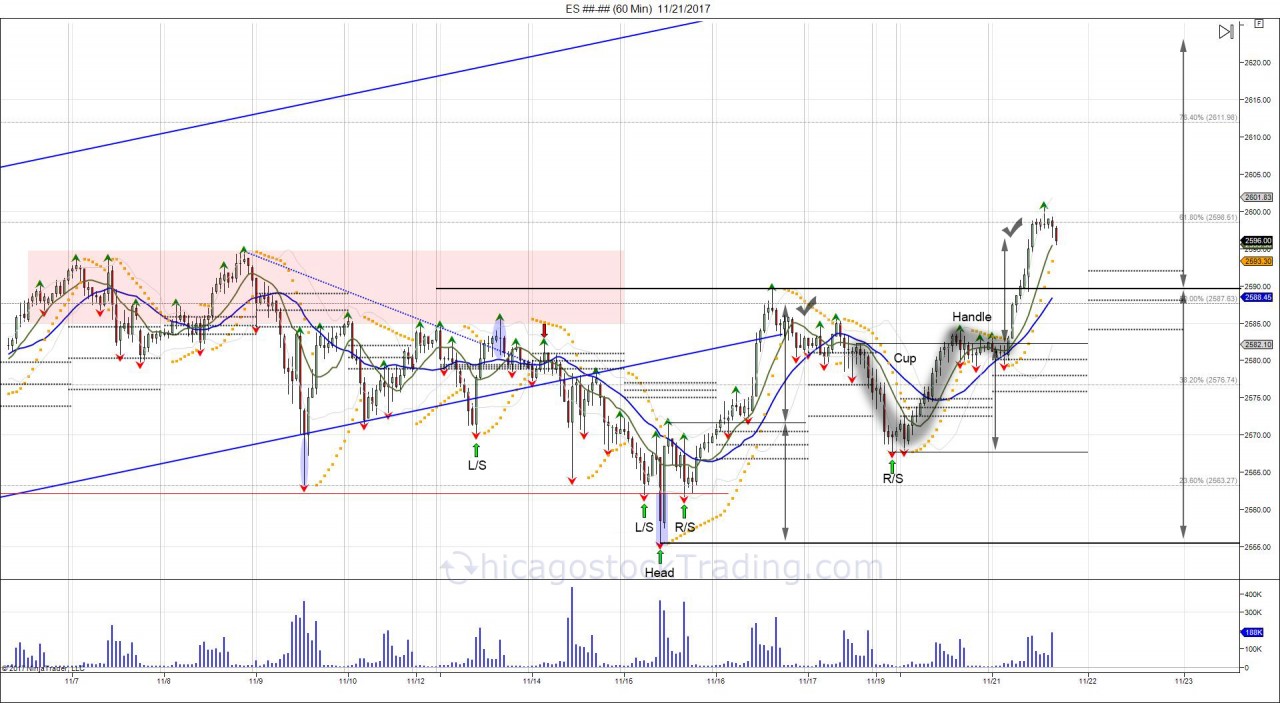
In the above chart, 3 technical patterns that developed the bottom. First the inverted head/shoulder from the failed breakdown last Wednesday on 11/15. After completing the upside objective and pulling back to test the head fake from last week, low of 256775 created a right shoulder of a larger head/shoulder pattern, within 258950-255550. Within this right shoulder, a 3rd technical pattern, being a cup/handle. Cup/handles form when market breaks, and recovers that break to create a U turn, aka the CUP. After longs get shaken out on the way down and shorts get squeezed on the way up, a period of sideways consolidation which does not give much of a pullback for buyers to get in, nor shorts to get out, forms to create the "handle". Breaking through the handle, saw the market complete its objective on Tuesday. Going forward, one final technical pattern, being the larger head/shoulder pattern within 258950-255550 has not been completed, which gives room to expand up to 2623. Wednesday's 3 day pivot range is below the market within 2592-2584 to provide underlying support for buyers to defend. Failure to do so and a close below the 3 day pivot range is needed to derail the current momentum.

Above the cup/handle from the August reversal giving projection of 2532 which saw the market completed early October.
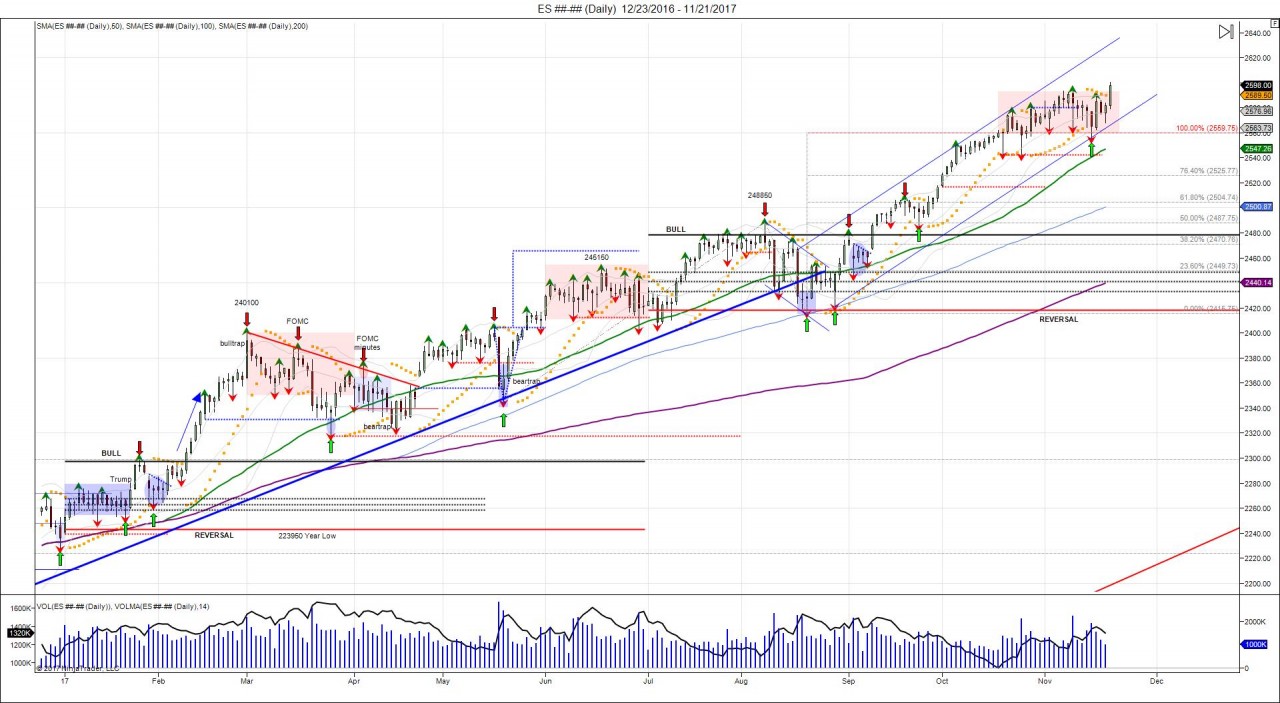
Since the September breakout above the 6 month vol window at 2578 and 5 day hold above that established a bullish 6 month bias (July-December), the market has melted higher without pullback allowing buyers opportunity to defend the 6 month vol window. This upside chase, saw the market extend into its 100% fib level of 255975. After running into this level, market attempted to correct with 2 lows on 10/19 and 10/25. With the 10/25 low failing to expand below the prior low, buyers stepped in once again to overcome 255975, turning the level into support as the market consolidated sideways for 3 weeks. After last week's failure to expand below the November low that trapped shorts and saw 2560 once again holding, the market has now broken through the 3 week range into new ATHs. Going forward, buyers have new support within 2590-2584 to defend Monday's 256775 low. Break of this low is needed to reject the breakout and setup a potential failed breakout. Until then, buyers have the upper hand to try and continue expanding higher into next levels. Notice the 6 month breakout at 2478 establishing a bullish 6 month bias developed similar to that of the February breakout when the market broke over 2300 to establish a 6 month bullish bias for the first half of the year (January-June). Whether or not the next upside levels will be completed (2623), we believe we are getting close to a short term high. To receive the 6 month vol windows for January 2018-June 2018, be sure to subscribe using the discount below.
All of the above charts posted on @chicagostock in realtime, with exception of the last daily chart.
Subscribe for daily market analysis, pivots, and volatility windows. Use coupon code "thanksgiving2017" on either product for a 50% discount on your first month! See you soon!