
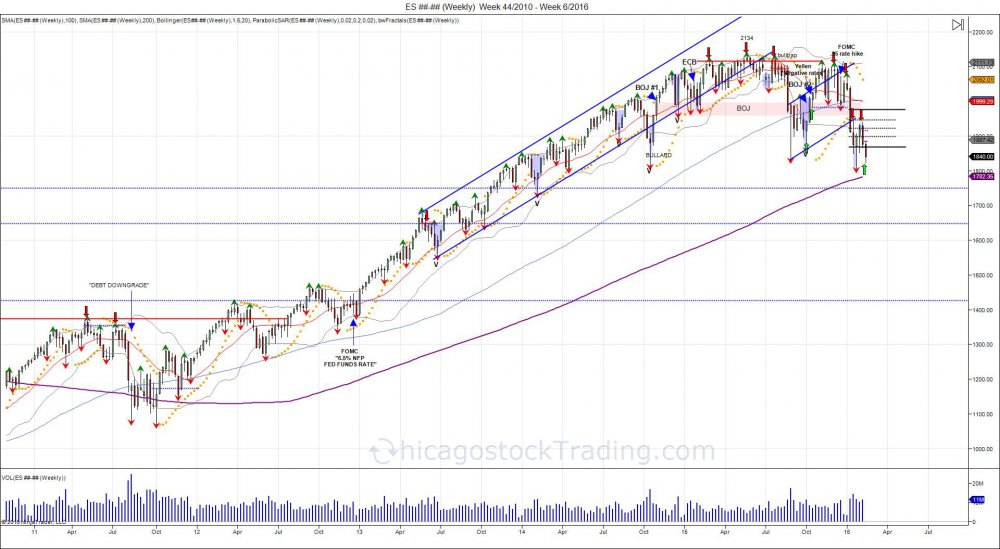
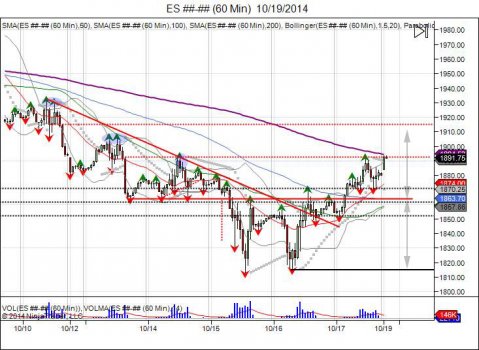
HOW DID THIS:
$ES_F Daily V bottom. Expansion > 1920 = test of year high. #psa pic.twitter.com/w558cz49I0
— Chicagostock (@Chicagostock) February 22, 2016
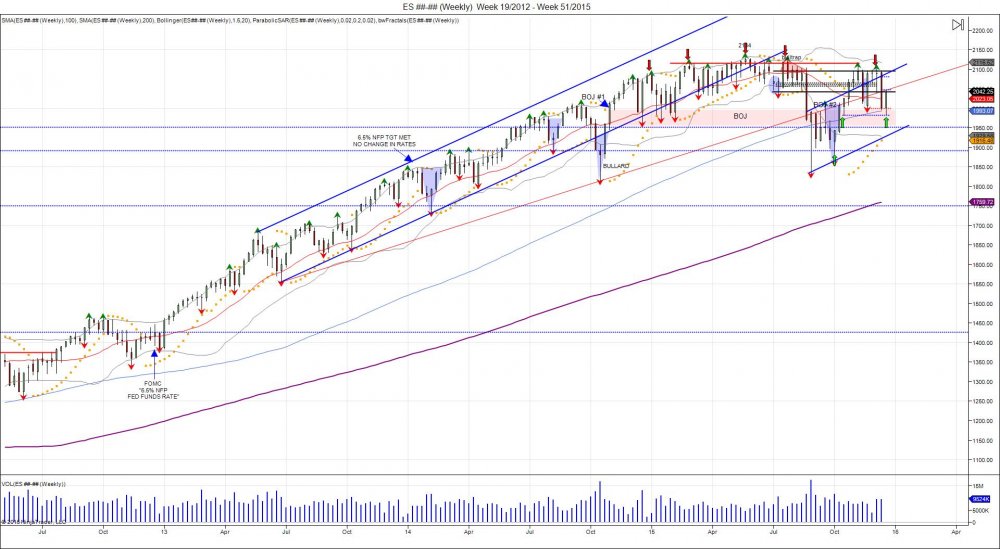
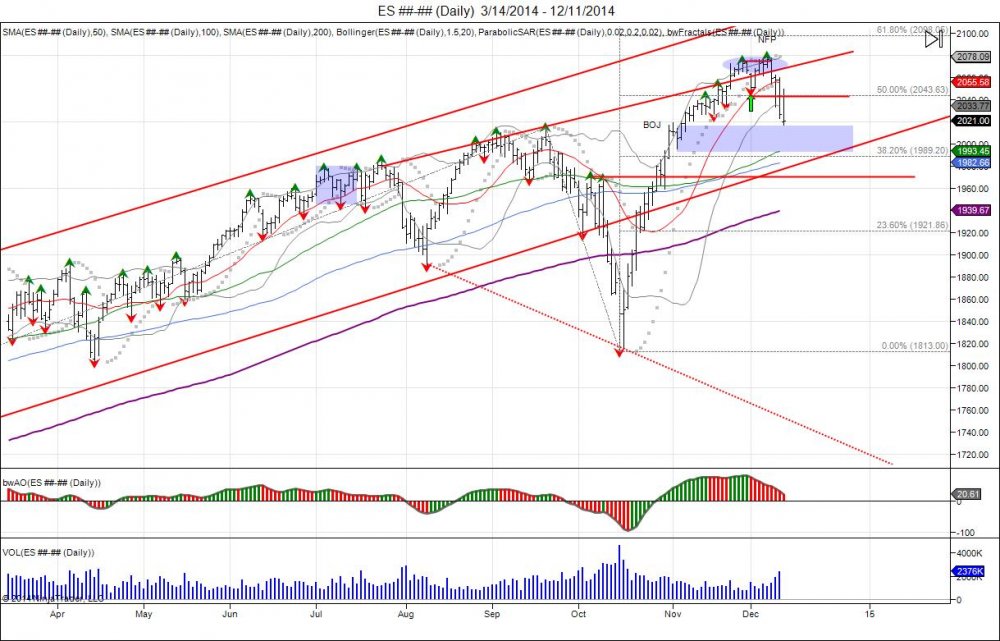
GET TO THIS?:
Commented on StockTwits: $ES_F Completes V bottom objective of 2042 from 1920. $SPY $SPX https://t.co/j102MzSsXB pic.twitter.com/yEP6aGyTfU
— Chicagostock (@Chicagostock) March 19, 2016
4185 Hits