Chicagostock Trading

Chicagostock Trading

Broken Wings Bonds/Yen

 ZB________Weekly___Week_36_2008___Week_33_2012.jpg

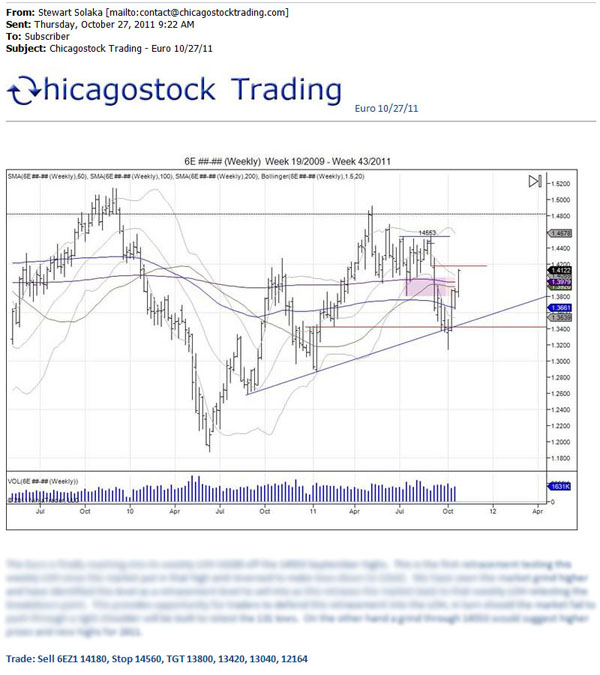
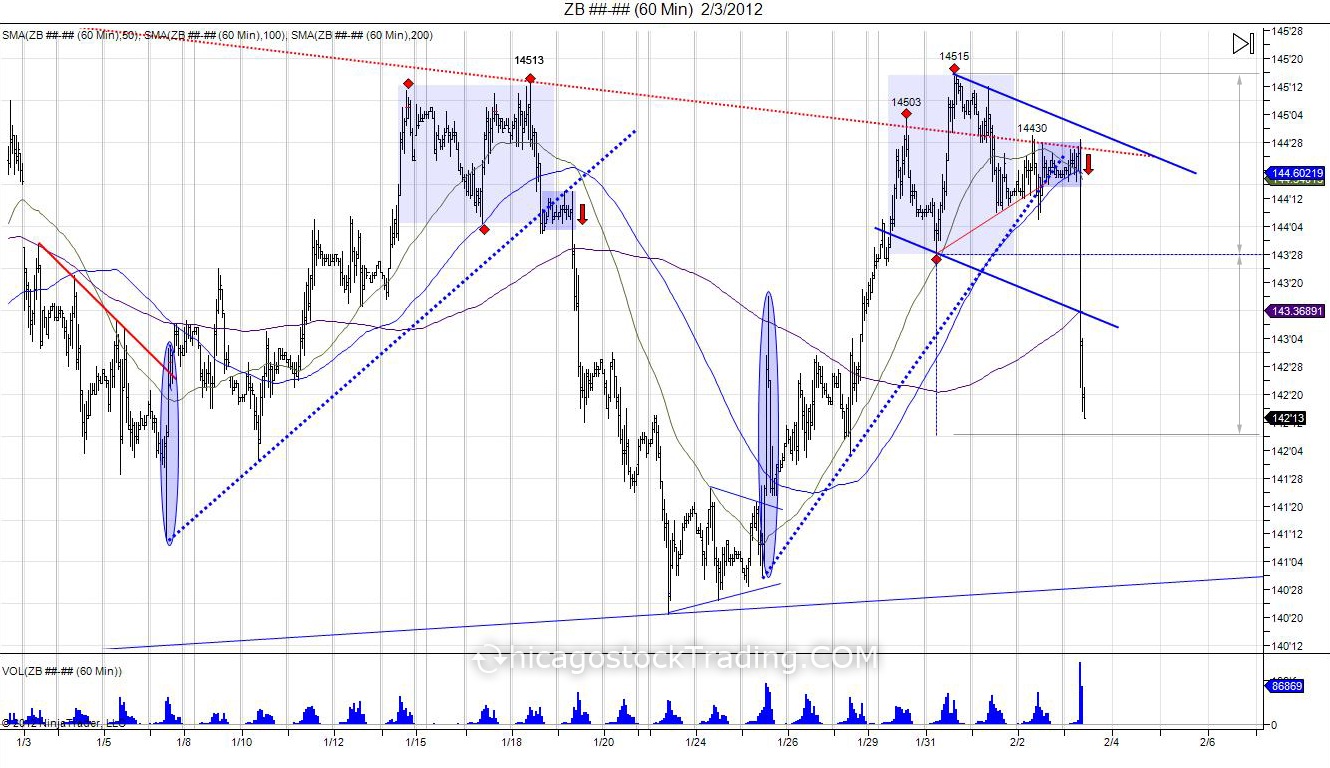
As seen in the weekly chart above, the 30 year bond has fallen back beneath its long term resistance from the January 09 to the September 11 highs.  The market attempted to hold above however overbought conditions with the new high in July at 15311, the bond did it's best to squeeze as many sellers as possible. Since this high, the market has rolled back beneath its resistance trendline, failing to hold prices above 14900.  The move has brought the market back down to where it broke out May of this year, just as the SP500 clipped the May highs of 1411.75. Stabalization can be seen here, however rallies up to 14900 offer sellers an area to defend with stops above 15311 to look for these recent lows to be retargeted, followed by a test of the year lows at 13505.


6J________Weekly___Week_25_2009___Week_33_2012.jpg

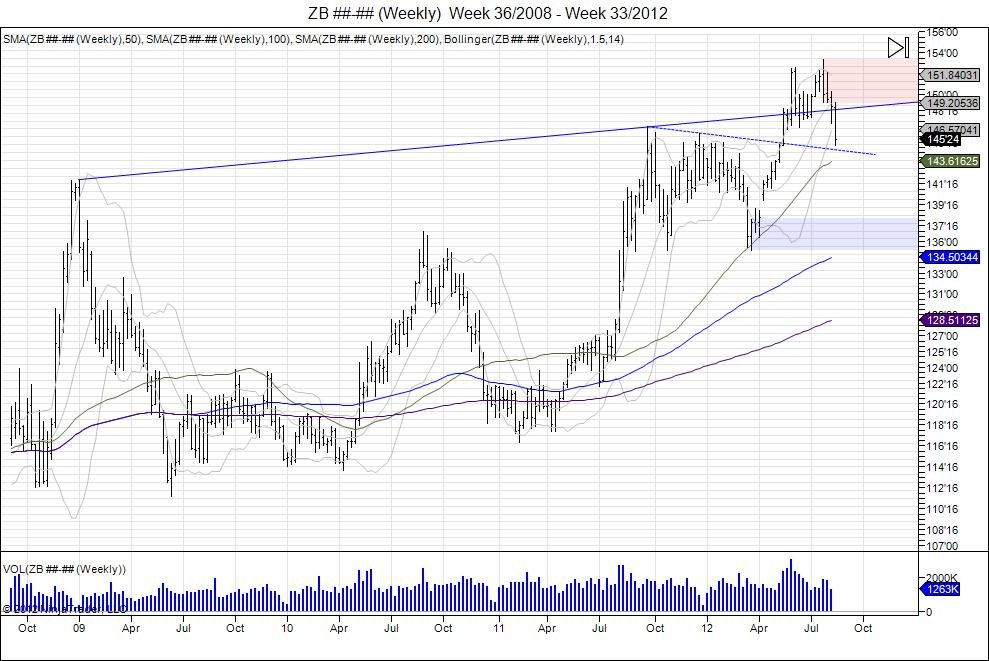
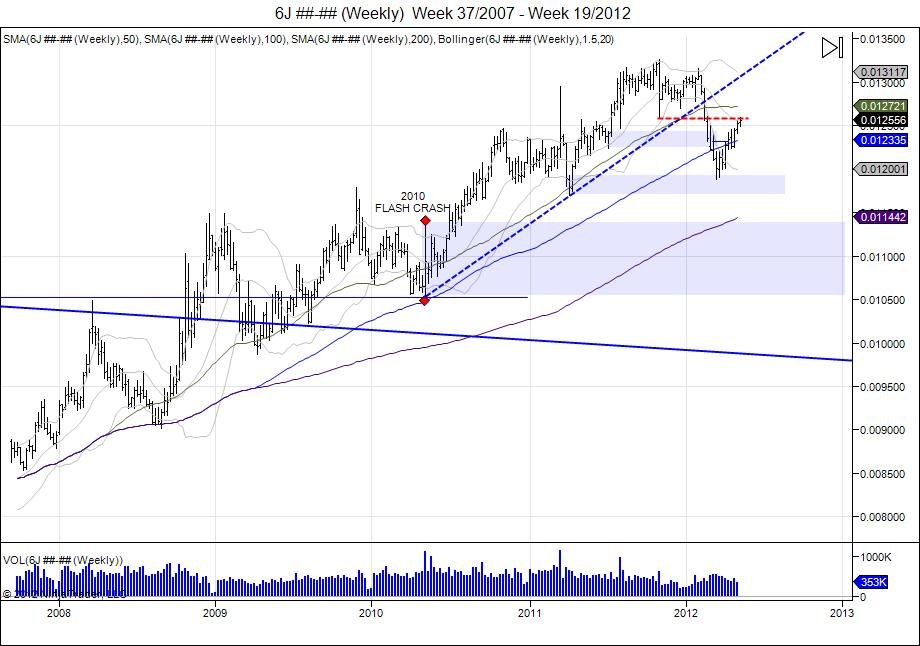
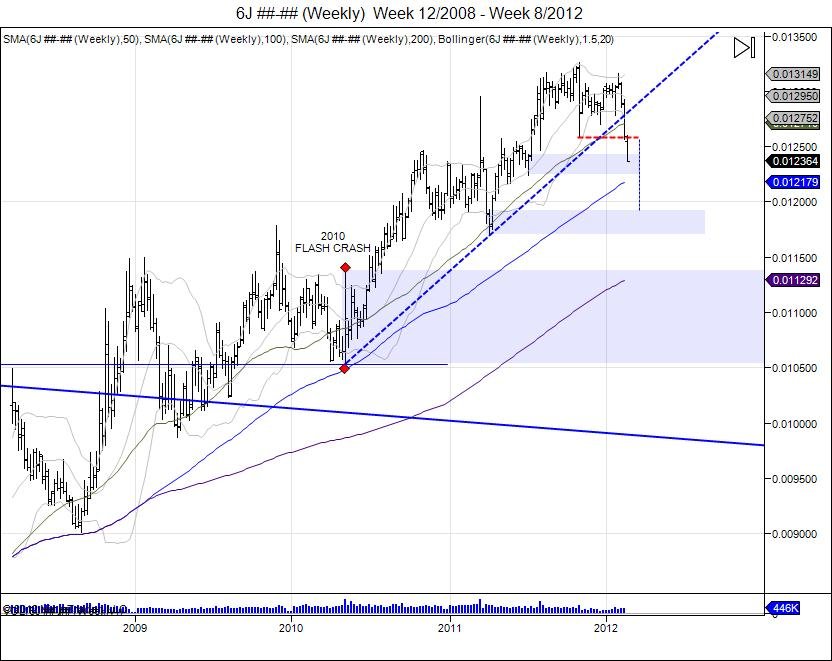
Since the Japanese Yen completed its downside target of 11900 in March of this year, the market grinded back higher, squeezing late sellers, leading to a retest of the year highs and late last year highs.  Over the past several months as the Yen rallied up to 12881, the market stalled and has begun to roll over.  Aggressive sellers have already taken advantage of this move by fading the highs and covering most positions. However looking at the weekly picture, this retest of last years highs appears to be a potential right shoulder of a larger head/shoulder formation.  There is a double bottom at 12416 where a breach of can confirm this right shoulder and see sellers attempt to drive the market down to retest the neckline of 11900 that the market bounced from earlier this year. At that time it was not ready to take out its support of 119-117, thus the short squeeze into retesting the highs. This is the target on the downside with a break below targeting 11375 which retraces the market back to where it broke out during the flash crash of 2010.


Continue reading
3551 Hits

US Dollar PPT

DX________Daily___8_17_2011___5_9_2012.jpg 


Continue reading
8782 Hits

Japanese Yen Back to its Neckline

 6J________Weekly___Week_37_2007___Week_19_2012.jpg

Continue reading
1243 Hits

Euro's Failed Break and USD Head/Shoulder

6E________Daily___11_14_2011___4_26_2012.jpg

 click to maximize

Ever since the Euro broke out of its downtrend from November in January after reversing off lows of 12627 and trading through the first trading day of the year range of 13020-13085, this range has turned into support.  This is the market showing us that the breakdown in January has a head fake and the market is attempting to reverse its momentum as it climbed back above that first trading day of the year range.  Since then, the Euro squeezed into testing resistance from December however was unable to continue the push which was followed by a retest of the 13020-13085 support.  This led to another bounce that failed at the now new resistance from February levels, which was followed by another breakdown to retest its support level.  This failure at the February levels turned into a right shoulder as the market came down to test its neckline as many shorts were looking for a break to confirm a head/shoulders formation.  During the month of April the Euro pressed against this neckline and even clipped it to put in lows of 13000 however held its 12975 lows from February and reversed back higher.  This led to a major consolidation and struggle to hold this neckline as the Euro has fought with its back against the wall trying to chip away at sellers and get the market out of this downward pressure.  This is needed for the market to try and squeeze higher to have shorts in as fuel for an upside rally.  Currently the Euro has worked through its 13200 resistance and is testing its next major resistance from the failed March highs which also meets with a downward resistance from the Feb-Mar highs connected.  Buyers who defended the 13020-13085 support level have opportunity again to lock in profits and leave runners to let the market work itself out to try and squeeze through this resistance.  A move past the March highs squeezes out the shorts who were looking for the head/shoulder breakdown and targets the February highs.  Moving past this February high squeezes out the remaining shorts giving fuel for the next leg up to try and retrace into 138 from where the market broke down from in October.  This 138 is the ultimate resistance in Euro off the 14241 highs and sellers should be looking at this level to defend.  As stated before the Euro is in short covering mode ever since it climbed above the Jan 3rd levels and support is seen down to 12890.  A break below 13000 would shake out weak bulls however taking out the year lows of 12627 is needed to put the ball back in the bears hands. 

 read more...


Continue reading
4401 Hits

138 Euro, 75 USD

6E________Daily___10_6_2011___4_23_2012.jpg

click to maximize

For the past 2 and half weeks, the Euro has consolidated and fought to hold its daily neckline stemming from the February - March lows.  This was breached on the 16th of March as the Euro hit lows of 13000, however quickly recovered and closed back above the trend line.  This shake out has seen the market continue to hold above its neckline, however meeting major resistance at the 13200 level.  Last Friday we saw the Euro close on highs hitting 13232, only to turn back lower on Monday and retest its breakout point.  This is at a critical level for the Euro as if this market is indeed ready to move higher, these Monday lows of 13107 should be supported for buyers to take out the  Monday highs of 13214 to show their strength of pushing back above 13200.  In turn the next major resistance comes within 13280-13387 from where the market broke down on April 2nd, as the range for buyers to squeeze through to target the February highs of 13488 and ultimately complete the retracement to 13800.  

more...


Continue reading
5545 Hits

Euro - USD Analysis

 6E________Daily___3_29_2011___4_11_2012.jpg

click chart to maximize

Since failing the test of the February levels late March, the Euro has fallen to retest its double bottom of 12975-13004.  This neckline is being threatened and the Euro is fighting very hard to hold with its back against this fence.  Upside resistance is met within 13195-13391 as the level to move through in order to break out of this downside pressure and move to take out the February highs to complete its upside target of 138.  Failure to do so and the neckline is in jeopordy of being broken for stops and to attract shorts where the January level will be retested with 12890 as support off that low of 12627, where a false breakdown can be seen to trap these sellers.  Ultimately the January lows need to be broken for the Euro to be back in bear mode, until then the market is in short covering mode and should continue to look into retracing to 138 where it broke down from 142.

DX________Daily___4_1_2011___4_10_2012.jpg

 click chart to maximize

The US dollar most recently has been testing its failed highs from March after the pullback found support at the February lows.  This test builds a right shoulder on a failure to take out this high, giving room to break the neckline of 7812-7880.  With that the 7800 level will have a better chance of being taken out as the market has tested and failed upside levels.  Downside target comes in to take out the October lows.  Currently fighting minor support at 79700.  Buyers need to squeeze March highs to fail this head/shoulder attempt and target the year highs in order to regain control.

Continue reading
3984 Hits

30 Year Bond, on the Edge, again.

 ZB 03-12 (120 Min)  2_29_2012_1.jpg

click image to maximize

Notice a pattern above?

Over the past 2 months we have seen the 30 year bond attempt to breakout only to fail.  Thus far, we have seen 3 setups that attempted this.  The first one was during January 13-18, followed by January 30-February 2nd, and most recently February 27-29.  All these attempts have couple things in common, one they were all led by short squeezes as the market tried breaking down but was not ready to, and two- as they tested the highs and tried to break out, they failed and created a 3 point consolidation that was followed by a selling.  Most recently, once again the 30 year tried to breakout as short covering led the market into testing its 14400 level, only to once again fail and create a head/shoulders pattern with highs of 14403/14411/14404.  This thus far has once again repeated the pattern and broken down as the June contract has taken over for the front month.  Lower highs, and higher lows are now being created and this market is getting tighter.

read more...


Continue reading
3704 Hits

Japanese Yen "Free Fallin"

 6J________Weekly___Week_12_2008___Week_8_2012.jpg


more...

Continue reading
3230 Hits

SP500 Video @ Nasdaq with notes

Click chart below to maximize.                                                        

  more...

Continue reading
8731 Hits

30 Year Bond Hourly Chart

zb2-3.jpg

 more...

Continue reading
3189 Hits

GLD Chart Update

 GLD (Daily)  12_10_2010 - 1_27_2012.jpg

more...

Continue reading
2912 Hits

The 2011 Euro trade that made $43k in 3 months.

On October 27th 2011, Chicagostock Trading recommended selling the Euro at 1.4180:

eurotrade10-27.jpg

more...

Continue reading
6238 Hits