Chicagostock Trading

Chicagostock Trading

FLASH BACK on the FLASH CRASH

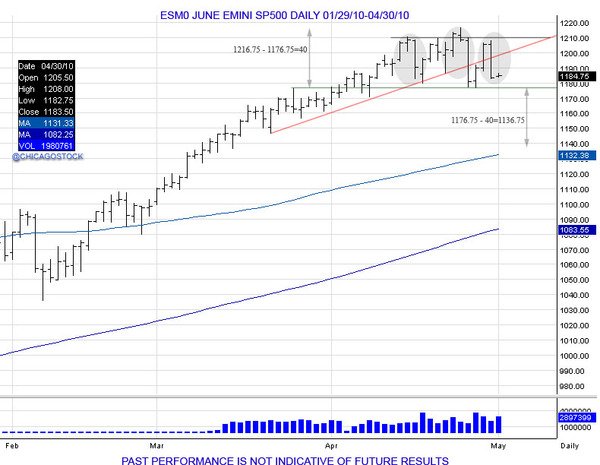
Going into May 6th, 2010, the SP500 was already having trouble on a daily basis, distributing within 1180-1220. After originally making a high of 1210.50 on April 15th, the market fell down to 1179.75 before recovering to take out the 1210.50 high and stop out early shorts.  This higher high up to 1216.75 failed to hold, seeing the market reverse to take out the previous 1179.75 low.  Lows of 1176.75 before another bounce was seen to retest the failed higher high at 1216.75.  The retest turned into a right shoulder as the market failed to push through the April 26th highs and fell through the previous low of 1176.75 to confirm a head/shoulder pattern.  Going into May 6th, the market had already broken below 1176.75 and had a target of 1136.75.


DRUDGE05_06_10.jpg 

SP5_6a.jpg

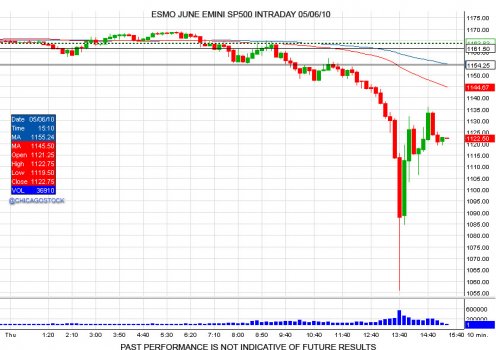
On the day of May 6th, 2010, the market was well below its 1176.75 neckline, opening at 1157.50 and making highs of 1165.00.  Pictures and videos of Greece riots being shown  added fuel to the fire. Things quickly deteriorated after the market fell below 1154 and turned the level into resistance.  This led to the head/shoulder target of 1136.75 to be completed.  With this target completing, this is when the flash crash flushed the market from 1130 down to 1056 before recovering back to the 1130 level into the close.

DRUDGE05_06_10A.jpg


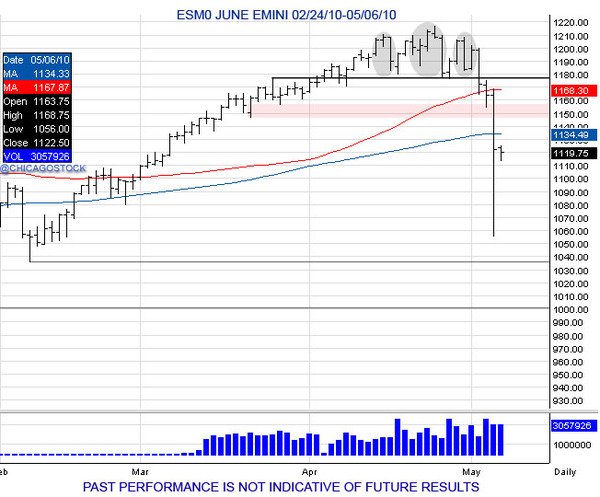
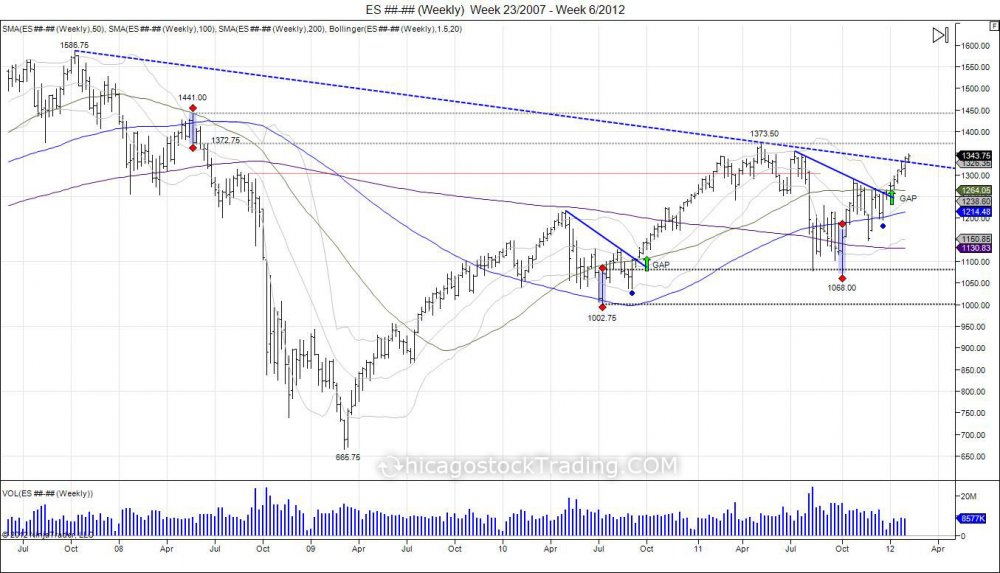
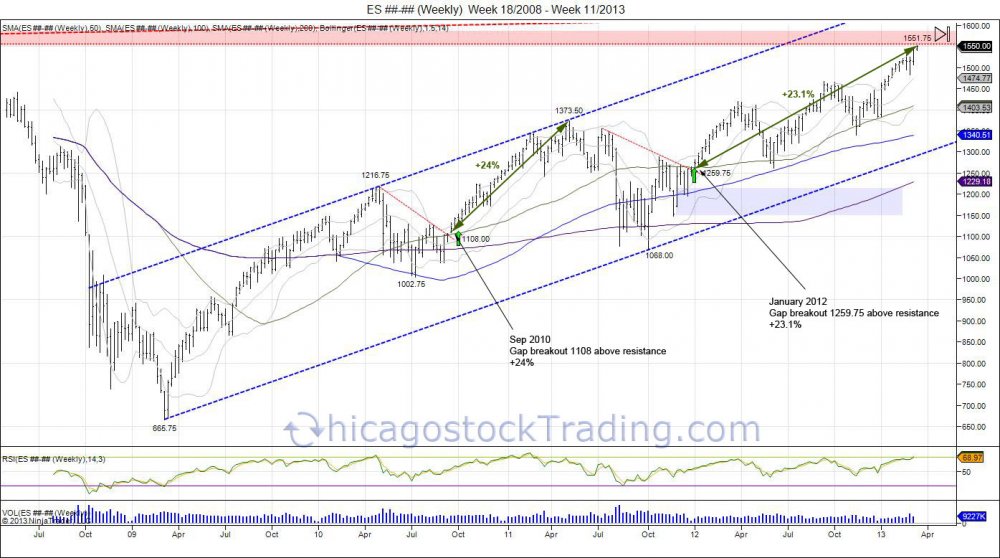
Eventually, the market retraced back to its broken neckline of 1176.75 by making highs of 1174.75 before turning back lower to "back and fill" the flash crash lows of 1056.  Lows of 1002.75 were made in July of 2010 before reversing off the lows and into 1127.75, being were the market failed the prior month in June.  With the markets back to whipping back and forth in attempt to consolidate and build a bottom, a retest of the 1002.75 lows was made with the market falling down to 1037.00 on August 25th just before Ben Bernanke's Jackson hole meeting.  During this meeting "Bernanke Says Fed Will Do `All It Can' to Ensure U.S. Recovery".  With the Federal Reserve promising to defend the markets, this turned the retest of the summer lows into a bottom and the markets turned higher to see a breakout "gap and go" on September 13th with the market making lows of 1108 and holding above the prior day's high close of 1105 to leave a small gap open, giving way for a short squeeze to move back higher and take out the earlier April high of 1216.75 which eventually led to 1373.50 on May 2nd, 2011 before going through another consolidation period that presented another correction, filling the 1105 gap. Another volatile period and more promises of support from the Fed led to another gap and go breakout to start 2012 with a gap open higher with lows of 1259.75, keeping open a gap down to 1252.50 from December 30th and giving way for another short squeeze to move back higher and take out the May high of 1373.50. Throughout 2012, the market kept this gap at 1252.50 open to create another bottom during summer, targeting the year highs.  Small correction in fall of 2012 as the 1441 upside target was completed, making highs of 1468 before falling down to 1340.25 in November to retest where the market broke out in August.  Since these lows, another gap has been made, with 2013 opening above 1440 with lows of 1438.25 and a previous close of 1420.  This has led us to where we are now as the market has gone through another major short squeeze, bubbling throughout the year to take out the all time highs of 1586.75 and breaking above 1600 on the latest non farm payroll number reported on May 3rd.  


Continue reading
5070 Hits

Where to Buy Gold

GC________Monthly___2_2007___4_2013.jpg


Since the December 2012 FOMC meeting that "Spooked the gold market" as the FOMC members attached a 6.5% unemployment for a target on rates, gold has fallen $362.6.  However since the failure to break above 1800 in 2012 and double topping at 1798.1, the market is down $442.8. So why the sudden crash over the past 2 days? As we know the market ran from 681-1923.7 as the FOMC cut their rates down to 0%.  The year of 2012 was all about consolidation.  It traded in a range of 1526.7-1798.1 which lured in a lot of late buyers betting on "hyperinflation".  As gold has most recently failed and broken below this 2012 low of 1526.7, it has confirmed the highs in 2012 as a double top.  This range of 271.4 (1798.1-1526.7) can now be subtracted below 1526.7 to give room to expand the market down to 1255.3.  This target when put out in December was looked at as a crazy and a lot of "gold bugs" were insulted. Today the market is bringing pain to these gold bugs as it shakes them out.  The current breakdown clears and shakes out buyers who came into the market above 1500.  The move is good for "smart" money who have been sitting on the sidelines awaiting for the market to go on sale. Completion of this move is seen at 1255 which also retraces the market 50% of its 681-1923 move. In the big picture, that would offer a 50% sale off the highs and bring the market back to where it broke out in 2010.  This range of 1200-1300 will offer an area of major support for the market to attempt to build a base for long term buyers to watch for to come in and buy the sale.  A break of 1150 would give room to test major support at 1000 being where the market broke out in 2009.  Failure to hold above sees the 681 low  targeted and at that point the long gold story would be all over. Short term yes the market is very over sold and the long community is in shell shock, the old lows of 1526 is now new major resistance with next level of sell stops below 1309.1 as the 2011 lows.


Continue reading
4403 Hits

Fear Turns to Greed at Breakeven.

2011 vs 2012 Patterns compared

ES________Weekly___Week_18_2008___Week_11_2013.jpg

Click charts to maximize.

The SP pattern from January of last year gapping open at 1259.75 above resistance just as the gap open at 1108 in September of 2010, is now mimicking the % move. The first breakout in September of 2010 at 1108 recall was just after the year of the Jackson hole QE start in August and the volatile period during that summer range to put in a bottom at 1002.75. The breakout in September squeezed a 24% rally leading the market into highs of 1373.50 to test the range from May of 2008 of where the fall out began. Last January this pattern was mimicked again with the market gapping higher at 1259.75 to start another breakout following another volatile period during the summer with lows of 1068. This gap at 1259.75 has held open and the wave has now squeezed the market up 23.1%, putting it right at the door steps of resistance from the range off all time highs of 1586.75. At this point the market is testing major resistance based off the all time highs and seeing a small pause. Whether the market can muster enough strength to squeeze through and stop out shorts to follow the Dow Jones average into new all time highs is yet to be known. The next major resistance would be the 1600 level as everyone sees, keyword everyone. The biggest risk is the SP500 not taking out the all time high, thus buyers remain complacent looking for new highs, buying pullbacks which gives way to setup bag holders.


Tags:
Continue reading
4148 Hits

Whats With Gold? FOMC Spooks Market. Double Top Eyes 1250.

 GC12_20_12.jpg


When gold made highs of 1033.9 on March 17, 2008, it was a day later when the Federal Reserve came out with a FOMC statement, lowering the target for the federal funds rate aggressively by 75 basis points down to 2.25.  It was during this year this federal funds rate had begun to see drastic cuts from the Fed, until it finally got to 0-.25% early 2009.  Throughout all of 2008 the funds rate dropped from 4.25-1.00%.  Throughout this time, gold also saw a correction as the economy crashed in fall of 2008 seeing gold prices down to 681 in October.   Having already seen a 99% increase in prices from 519.5 to start 2006 into 1033.9 in March of 2008 this gave some reasoning for people to sell and take profits.  The shakeout brought prices down to 681 in the fall before bouncing off these lows.  This led to another push back at the 1000 level where the market coiled like a spring looking for direction.  During this time, 90% of the investment and trading community did not expect to see gold to run through 1033.9 anytime soon.  Sure enough,  with the third attempt in 2009, the breakout was seen: http://twitpic.com/co4yy.  This breakout created a parabolic run seeing another 86% added on top of 1033.9 to run into highs of 1923.7 in September of 2011, just 3 years after making the 681 lows.  All throughout this time, the fed funds rate remained 0-.25%.  The investment community jumped on the bandwagon and commercials for gold investments skyrocketed.  Since making this parabolic high of 1923.7, a correction began as the market looked to consolidate the move (http://twitpic.com/7bylsj).


2011 closed out with prices trading at 1566.8.  For the year of 2012, it has been all about consolidation.  The market once again ran into the 1800 resistance level early in the year with highs of 1792.7 before seeing another correction down to 1526.7 in May.  Not ready to move lower, the market held the December lows of 1523.9 and squeezed shorts and sellers as the market returned back to the highs of the year, once again pressing that the 1800 level.  The market put in highs of 1798.1 in October.  Once again, failing to push through 1800 for the THIRD attempt.  This created a double top for the year of 2012 with highs of 1792.7 and 1798.1.  Thus far the market has fallen back to the mean of the year inside the 1660 level.  This pullback has the market retesting where it broke out in  August of 2012 where the market pushed above the 1640 resistance level that troubled it during the summer.  This is now MAJOR support for the market and for gold bugs to defend.  The pullback offers the gold bugs this retracement to defend this pullback where the market originally broke out, turning old resistance of 1640 into new support.  Unfortunately, gold bugs defending this pullback must look to risk a break below the 2012 low of 1526.7.  Since gold is in a trading range of 271.4, this trading range gives the target on any expansion outside the range. Meaning a breach of 1526.7 gives room down to 1255 which would retrace the market down to the June 2010 high and just a little over a 50% retracement of the 681-1923.7 move.  Conversely, should buyers be able to hold the 1526.7 lows (which I don’t expect), a move through 1800 can see an upside target of 2069.5 by simply taking the range of 271.4 and adding it to 1798.1.  This is the task for next year, 2013 to find direction in the gold market. Throughout 2012 the market consolidated and traded within this range of 271.4 and put in a failed higher high at 1798.1 which gives the potential of a double top.  Of course just as 90% of the community was bearish gold sub 1000, 90% of the community is now bullish gold.  Regardless, we have a range bound market seeing pressure to break lower and shake down to 50%. This comes on the heels of the latest FOMC statement where for the first time since dropping the Fed funds rate to 0-.25%, the Fed finally attached a target to how long they will keep interest rates this low.  In the latest FOMC statement on December 12, 2012, “… the Committee decided to keep the target range for the federal funds rate at 0 to 1/4 percent and currently anticipates that this exceptionally low range for the federal funds rate will be appropriate at least as long as the unemployment rate remains above 6-1/2 percent…”. After 3 years of having low rates with no target, a target now given, the gold market is being cautious and since this FOMC statement, already down $82 to 1636.


Continue reading
15505 Hits

Paul, Bernanke, and Dollars Under the Mattress

During the last FOMC conference on January 25th, we highlighted Chairman Bernanke's comments about how the inflation rate only hurts one if they "do their life savings in a mattress"  

Today, Congressman Dr. Ron Paul questioned Chairman Bernanke on this comment:

4:50- "In January at one of your press conferences you said that, you sort of poked a little bit of fun at people to downplay the 2 % inflation rate. But if you say it's 2, I say its 9, lets compromise for the sake of argument its 5%.  You said that it doesn't hurt you unless you're one of those people who stick their money in a mattress, but where are you going to put it? Are you going to put it in a CD and not make any money at all?"

more...

Continue reading
3680 Hits

The Fall of the US Dollar

 DX________Daily___8_12_2011___2_6_2012.jpg


Since the US dollar put in its “Island Bottom” in October of 2010 with the failed breakdown of 74860, the market reversed to create an inverted head and shoulders with a neckline of 77855, targeting 8100.  After breaking through its neckline in November, this 77855 level turned into support and the short squeeze was on as the market squeezed into completing its inverted h/s at 8100.  Consolidation was seen at these highs with a tug of war taking place.  The market began 2012 on Jan 3rd with lows of 79830 and highs of 80225.  Following this first day of trading, the market ran into new highs, touching off at 82045 on January 13, 2012.  This 8200 level turned into the last hoorah for the short squeeze, trying to get as many shorts out as possible, as the market began to roll over and broke its uptrend line from the October lows on January 18th.  Following this break of the uptrend, the market began trading in a newly formed channel pointing down as it targeted the year lows at 79830.  These lows for the year were eventually taken out on January 23rd, leading up to the January 25th FOMC statement by the Fed chairman Ben Bernanke.  On the 25th as the Fed released their FOMC statement, the US dollar had attempted to rally, however failed.  Putting in highs of 80505, only to reverse into lows of 79515.  Since this FOMC and break of the year lows, this level has now turned into major resistance for the past 2 weeks at 79515.  The year lows that was support at 79830 has also turned into major support as the market reversed its early momentum in the year.  At this point the market has reached its 100day moving average on the daily chart and has been in consolidation mode in a fight to hold this support as upside resistance is being tested.  Pressure remains to the downside now with the Jan 3rd range of 79830-80225, followed by the FOMC high at 80505 as major resistance.  A push past these levels would be needed to get buyers back into control, however only leading to retest the next major resistance coming in at the year highs at 8200 where a failure would create a right shoulder.  The question is will the market rally up to test this high and give sellers an opportunity to get out or continue this chase to the downside.  Buyers who did not get out in time from last year’s rally are now seeing the pressure turn against them. Below the 100day moving average on the daily, next major support comes in at 77855 being the old neckline from November, followed by the October head at 74860 and year lows of 72860.

  more...

Continue reading
5226 Hits