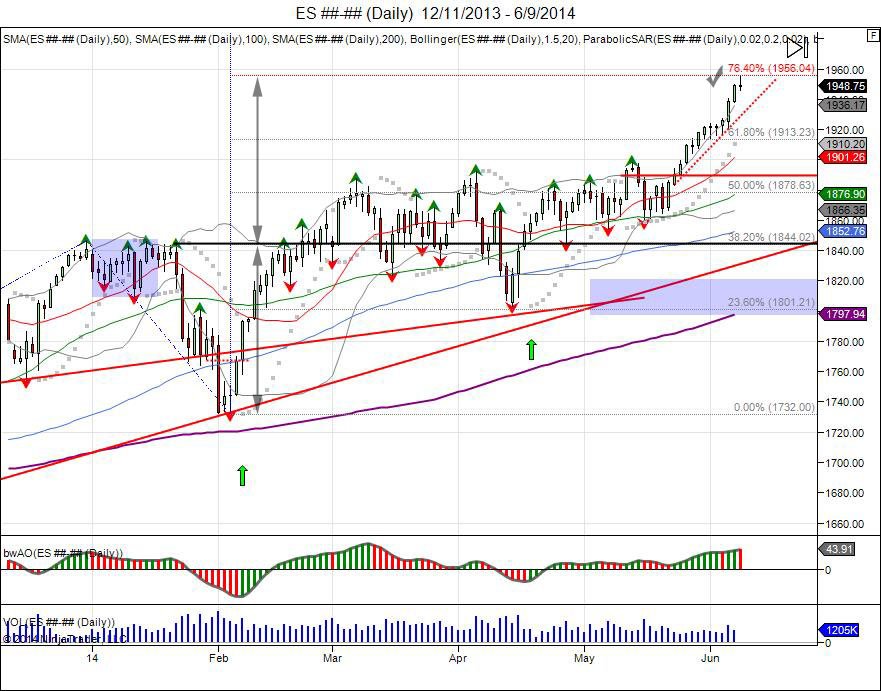
The SP500's breakout in May has expanded its January correction from 1844-1732 of 112 points with highs of 195475 missing the marker by 1.25 (1844+112=1956). This comes after the correction in January setup a bear trap which was followed by a V shaped bottom, squeezing out those shorts. For the months of March through April, the market made peak highs on job reports, however remained below 1900 and held above 1800. This range tightened in May with the jobs number failing to take out the previous high, putting in a lower low at 1886 on May 2nd. This lower low for the first in 3 jobs releases lured in shorts as it setup a failed retest and breakout of the April highs at 1892.50. A correction was attempted following this lower high, only to hold at 1859, holding the May low of 1854.50 and preventing a reversal on the month to confirm the short side. This failure to take out the monthly low caught shorts trapped as the market gapped open on the 21st at 1874 from its prior day close of 1868 and pressed to take out the May 2nd jobs number high of 1886. With this jobs number taken out, the short side was forced to cover, using this as fuel to break through 1900 and take out the 3 month range which gave way to expand the 1844-1732 V bottom up to 1956, as well as meeting the 76.4% fib extension at 1956. This level completes the short squeeze objective and the range expansion objective, however the pressure remains to the upside as the breakout is in a parabolic period. The latest leg from 1924 up to 1941 was sparked on high volume with the news of ECB going to negative interest rates. The jobs report gave the last spark into 1950 on Friday and this created a spillover effect, seeing Monday continue the rally into 195475, meeting its objective, before going into profit taking.
Going forward, a daily close below 1945 gives way to back and fill last week's ECB squeeze with lows of 1921 to retest the breakout point and major support down in the 1920s with sell stops below 1913. Failure to hold 1913 gives way to shake out the long side and retrace back to the range highs down to 1900-1890 from the original breakout point in May. This provides buyers an area to buy on a pullback as opposed to chasing the market on the highs. The pivot for the rally comes at the May lows as a breach below the May low reverses the upside momentum. Above 195650 sees the 100% fib extension up to 2025.
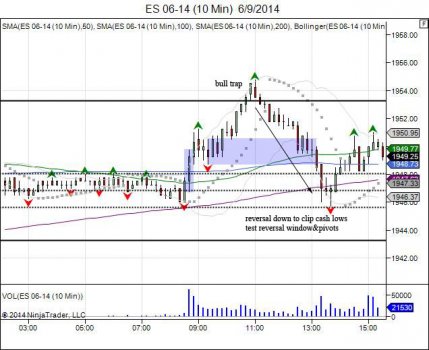
Monday's intraday action saw the squeeze spill from last week as the SP opened against the 1850 level and squeezed through to complete its move into 1955. This fell short by a tick at 195475, however was enough for the market to see a hold above it's intraday volatility window at 195325 to establish a bullish intraday bias. This bias turned into a bull trap as the market held just enough to setup the bias and lure in late buyers before seeing a reversal down to take out the cash open lows and shake out intraday longs, falling into the reversal window of 194625, however failing to hold below and seeing a bounce back to 1950. This lack of decisiveness on Monday has setup Tuesday with no pivot range, giving way for expansion in volatility. Subscribe today to receive the daily volatility windows on ES, CL, GC, ZB, and 6E.
RISK DISCLOSURE: PAST PERFORMANCE IS NOT INDICATIVE OF FUTURE RESULTS. THE RISK OF LOSS IN TRADING FUTURES AND OPTIONS IS SUBSTANTIAL AND SUCH INVESTING IS NOT SUITABLE FOR ALL INVESTORS. AN INVESTOR COULD LOSE MORE THAN THE INITIAL INVESTMENT.