(click chart to enlarge)
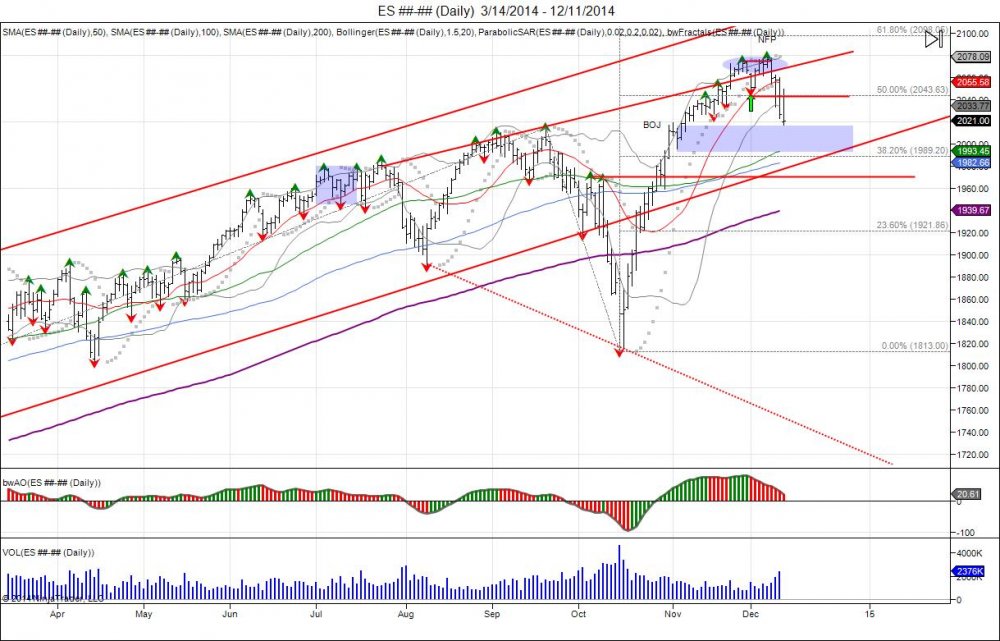
The SP500 has come a long way. Starting the year at 1838 to put in lows of 1732 and make highs of 2079 as of recent. The 2nd half of the year has seen volatility expand. July began just as January did, a very tight trading range followed by a small pullback before rallying into new highs. Difference in the 2nd half was the new highs was rejected in September, with the market falling apart in October to take out the August low and fall into 1813, testing major support based off the April lows. The break of the multi year bullish channel, was followed by one of the most massive and violent short squeezes ever. Just as early October the market put up a strong fight with violent short squeezes before finally letting go down to 1813, the move back to 1970 was just as violent. The reversal from 1970 to 1813 and back to 1970, was a major short squeeze and V shaped bottom. After this short squeeze, it was time for the market to take a breather, consolidate, attempt to build a base and support for new longs to join for a new leg up. What happened was a different story. Rather then allowing buyers this opportunity… Halloween 2014, just as the SP was pressing against major resistance against the September highs, BOJ came out with an expansion to their QE program, lifting the lid above the September highs and seeing the SP trade through 2k for the first time ever. Rather then allowing the cool off period at 1970, the BOJ squeeze forced buyers to chase the market above 2000. November made early lows at 1995, before grinding up to into highs of 2072 going into the Thanksgiving holiday. During this period, the cash market worked very hard to open and settle the market at its prior close, walking a very tight line. Following the holiday, the market saw a gap open lower down to 2048, only to becoome a bear trap as the following day the market squeezed back above 2060 to save cash buyers and grind out new highs. Draghi came out on the 4th of December, touting a ECB QE program in January which led the market to scetch out another new high at 207725. All of these highs were made by a few points and saw profit taking into them. The following day was NFP and the SP managed once again to squeeze 2077, print highs of 2079, and fail to hold above. This led into a break out failure, seeing the market fall back to retest the December 1st low of 2048.
The SP’s move below the Dec 1st low of 2048, has confirmed a short term failed breakout above 2077 and a double top. The move now is testing major support down to 2015 based off the November low of 1995 that led to the chase higher. The current break has caught longs off guard and sellers are looking for blood to press the market lower. Failure to hold the November low of 1995, confirms a failed breakout above 2000 as the market retraces back below the BOJ QE breakout and leaves buyers who chased above holding the bag. First major downside support is seen down to 1977 to retest the breakout point from October’s V bottom 1970-1813-1970. The question that will arise and will be seen is will there be buyers left to buy the market at this level, after the BOJ forced them to chase above 2000? This will leave for a thinner bid on the downside and more longs who are caught giving way for volatility to expand. A failure to hold 1970 gives room down to retest the 1813 low with major support down to 1840. The objective for the sell side is to take out these lows and test the 2014 low of 1732 with support coming in at 1750. To reverse current momentum, buyers need to recover above 2050 to retest resistance at 2068 based off the highs of 2079. The objective for the sell side is to settle the market below the December 1st lows to establish a weekly sell signal and bearish engulfment.
(click chart to enlarge)
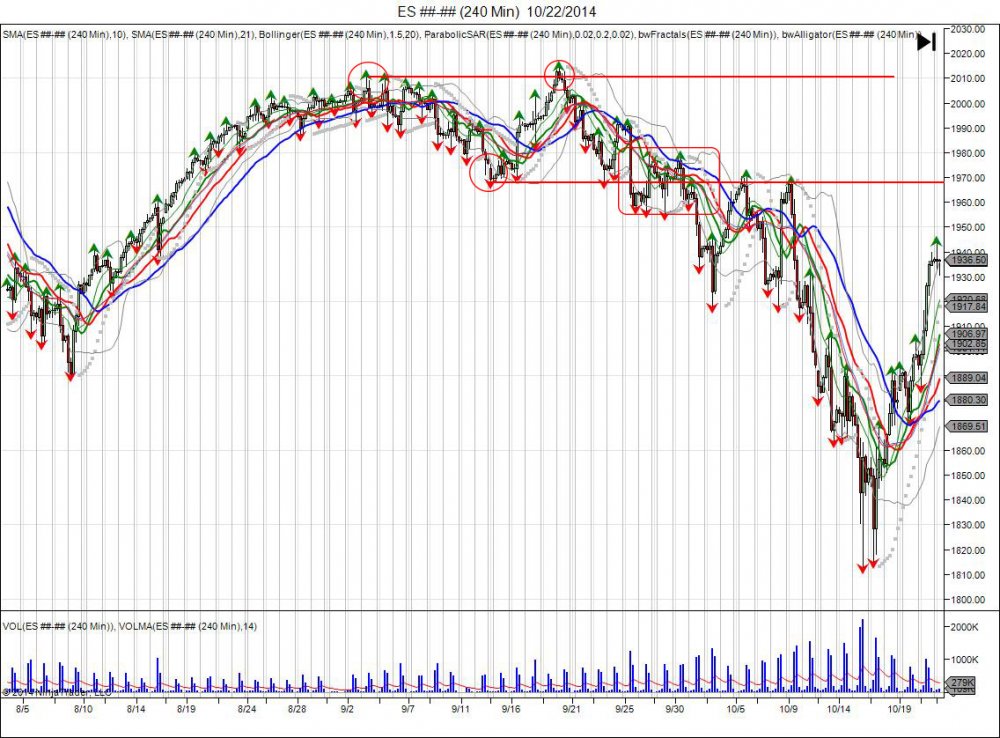
Above is what happened in October. The recent feel in the SP with the violent short squeeze higher after rejecting new highs and new lows, felt like déjà vu. Sure enough, pull up the charts back to October, we see market had a low it rallied off of in August, this led to a new high, followed by a small pullback, and another new high that was rejected. The rejection of this new high below 1970 in October led to the violent short squeezes before finally letting go into 1813. Fast forward to now in chart below:
(click chart to enlarge)
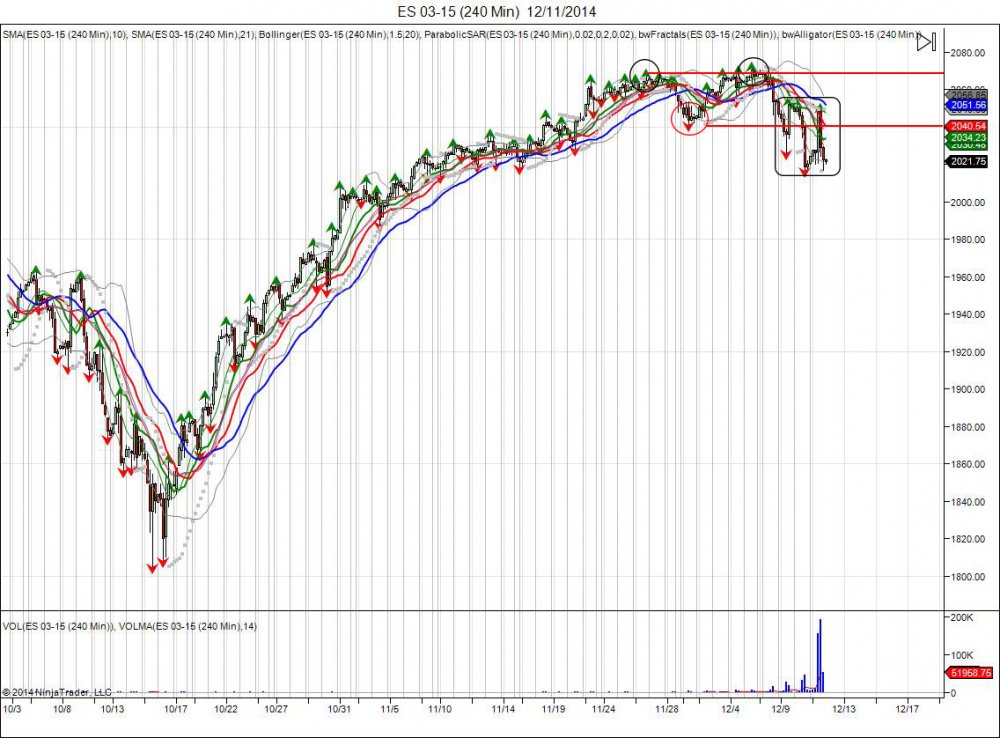
Similar setup taking place, market rallies off lows made in October into new highs. New high sees a small pullback, followed by a higher high that is rejected to take out the previous low. We are now at the same spot we were late September. For this pattern to match the October pattern, a move down to 1750 is the objective. A move above 2050 is needed for a squeeze to retest highs of 2968 and trap shorts below 2050.

(click chart to enlarge)
Looking at the cash chart above, we can see the 2nd half of the year’s volatility create a “megaphone” pattern. The recent expansion into the top of this range led the market to briefly trade above, during the Thanksgiving holiday. Early warning signs came in when the market opened lower at 2048, only to be used as another bear trap to rally into the December jobs number and squeeze out a new high of 2079. The following week, the market rejected these highs and has fallen below 2048. This is now a new level of major resistance as the market reversed below, leaving buyers above trapped. Sellers target the 38.2% fib extension at 1977 to retrace back to the breakout point in October and take out the November 1995 lows to shake out longs. As seen in the cash chart above, the move from 1813 up to 2020 was very violent, and the way the market was able to move so fast to the upside was the gaps created with the overnight trading strong and the cash market opening higher to “jump” resistance. This created 6 gaps on the way up (highlighted in blue in chart), that will eventually be filled on the way down. Projection of the “megaphone” gives an objective of 1750 for a test of the 2014 low at 1732.
(click chart to enlarge)
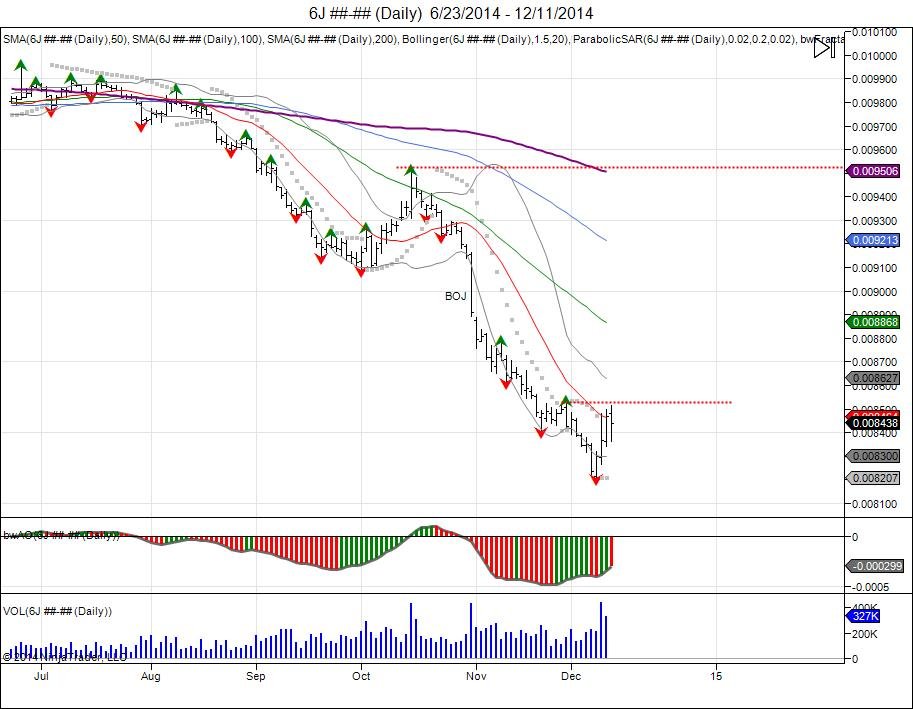
Just as in October the SP made it very difficult to be short with all the “violent” short squeezes that ended up fizzling out, the Yen provided a good hedge in October, which led to a move into 9500. This move after completing its objective was quickly sold down to the October lows. The BOJ announcement on Halloween created a massacre of longs, grinding the market down to lows of 8406 in November. The market attempted to bounce, only to see another flush take place in December with the market falling down to 8207. These lows were done on Sunday night with the market opening on the lows to shake out longs and lure in shorts, only to trade higher and take out the December high (just as the SP took out the December low). This move above the December high has created a short term reversal with the market pressing against major resistance against that late November high of 8531. Weekly close above the monthly high of 8486, creates a weekly bullish engulfment to offer buyers a new low to defend in attempt to expand and retrace the market higher. A reversal up, targets a gap created by the BOJ at 8903 with room up to 9300 to squeeze shorts and test major resistance based off the failed October high. A move through the October high reverses the overall bearish trend, with room to expand up to 118 to retrace back to the 2012 close.
Sign up for a 2 week free trial to receive daily SP500 analysis. Click here for more information.
RISK DISCLOSURE: PAST PERFORMANCE IS NOT INDICATIVE OF FUTURE RESULTS. THE RISK OF LOSS IN TRADING FUTURES AND OPTIONS IS SUBSTANTIAL AND SUCH INVESTING IS NOT SUITABLE FOR ALL INVESTORS. AN INVESTOR COULD LOSE MORE THAN THE INITIAL INVESTMENT.