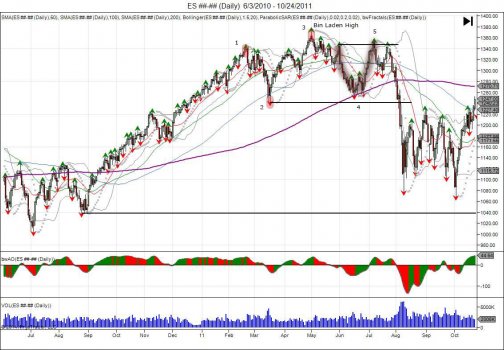
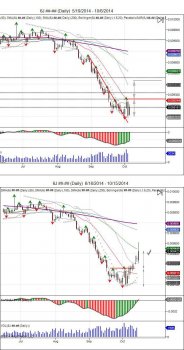
The recent reversal in the SP500 has reminded us of a similar time the charts and reversal felt and looked the same. The above chart is from 2011. As seen the market made an early high of 1335 in February, correcting down to 1241 before rallying back to new highs. New highs were made on what was called the "Bin Laden" high. On the news of his capture, the SP printed the highs for the year at 1373.50 and turned lower to retest the previous 1335 lows made in February. This retest was followed by a "U" shaped reversal that recovered back to where the market failed at 1348 on the 1st of June. This reversal failed to stabilize and push through the highs, leading into what developed the right shoulder for the 2011 head/shoulder top and crash down to 1080 that was fueled by the debt downgrade. QE 2 ended in July 2011, just as QE 3 is expected to end 10/29/14.
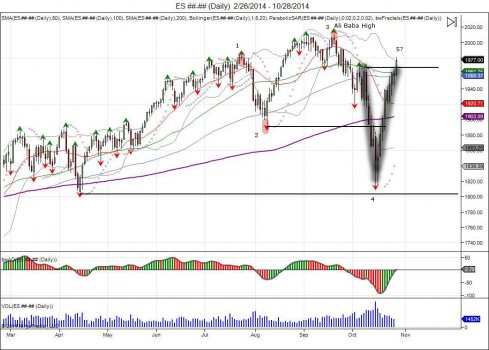
As we look at the SP500 today, the similarities to 2011 are interesting. The early high was made 07/24/14 at 1985.75, before seeing liquidation and bear trap down to 1890 in August. This was followed by a squeeze through the previous high of 1985.75 where new highs were made on September 19th. The highs were done on the news event of "Ali Baba's IPO", similar to the "Bin Laden high" in 2011. Since this news event, the market retreated lower to look for support, however was unable to find new buyers sustain prices above 1970, falling to retest the previous low of 1890 made in August. Unlike in 2011, the difference here is the SP500 breached its previous low (1890). The breach of the low, confirmed a failed breakout on the daily chart and shook longs from the market as it flushed down to test its next major support from the April 2014 lows of 1803. The market held these lows 10 handles higher at 1813 before seeing this massive reversal to recover where it failed earlier in the month at 1971, days before the month ends and just before the FOMC statement on 10/29/14. Similar to 2011's "U" turn where the market failed the retest of the highs in July, the market is attempting another retest of the highs here. With the market falling from 1971 to 1813 and back to 1971, it is set as a jump ball going into the FOMC statement. Shorts have been squeezed out, and it is up to new buyers to come in and carry the ball. Ideally, for another leg higher, a pullback and search of support would allow buyers opportunity to defend as opposed to chasing into this squeeze. Earlier in the month, the market showed us that it was "too long", as it setup the head fake early August that was followed by the reversal through 1970, only to fail in sustaining prices, and seeing buyers lose out on every dip as the market broke below 1890. This showed even after the August reversal and squeeze of shorts, the market was unable to find enough new buyers. As we've had another violent short squeeze, we are retesting the scene of the crime at 1971. The question going forward is the market still "too long"? If you were a bull, you were buying the pullbacks and when the August lows were taken out, you were shaken out. The other long opportunity came at the retest of the April lows. Now that the market is back to this crime scene of 1971, the same bulls are tooting their horns as if the sell off never happened and dip buyers did not get hurt, looking for the chase above 1970 into new highs. Fear turns to greed at breakeven? Best case scenario for the bull is to pullback and search for support down to 1900. We are not saying this will end up like 2011, but this retest here is very similar to the retest seen in July of 2011 that saw the market correct 20% from 1354 to 1077. Next major support below 1813 is seen at 1750 to retest the year low of 1732. A breach of this low derails the whole 2013-2014 momentum and gives way to fill the gap down to the 2012 close of 1420, 28% lower from 1971, similar % move as the 2011 decline.
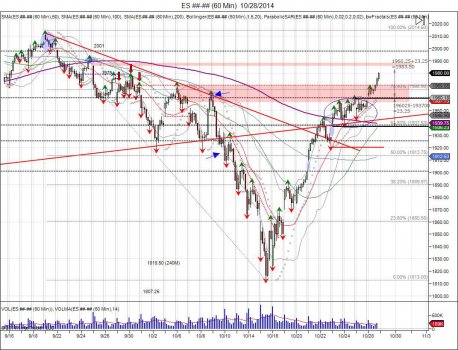
The hourly cash session chart above, we see the reversal back saw the market stall from 10/23-10/27 as it ran into major resistance against 1964. This created a trading range within this period of 196025-193700. On Tuesday, the 28th of October, the SP500 opened above this range, trapping shorts below, and attempting to expand the 23.25 handle range (1960.25-1937.00) up to 1983.50 (1960.25+23.25). Tuesday saw the market approach this target with highs of 198075 before backing off. Going forward, a cash open above 1960 keeps pressure against shorts to attempt a completion of this target at 198350 and attempt to fill next major gap and resistance against 1988. Cash open below 1960 would leave buyers above from Tuesday's session trapped, giving way to target the bottom of the recent range at 1937 where a failure to hold gives way back to filling the gaps that began the squeeze, first at 1926 and 1900.
Keep in mind: The recent correction in the SP500 came as the Japanese Yen tested and held its recent lows on October 3rd, seeing a move above 9260 that led to its short term objective of 9450 completing. Yen overall remains in a downward bearish trend, however as the Yen completed 9450, it has backed away, and the SP500 has marched back up. The Yen is now back to retesting 9260, which was old resistance, in search for new support. This is the level for new buyers to defend the pullback and use a breach of the October lows to exit. Their objective is to reclaim the October high at 9510. Doing so confirms a change and reversal in overall trend and will also continue to put pressure on the SP500.
RISK DISCLOSURE: PAST PERFORMANCE IS NOT INDICATIVE OF FUTURE RESULTS. THE RISK OF LOSS IN TRADING FUTURES AND OPTIONS IS SUBSTANTIAL AND SUCH INVESTING IS NOT SUITABLE FOR ALL INVESTORS. AN INVESTOR COULD LOSE MORE THAN THE INITIAL INVESTMENT.