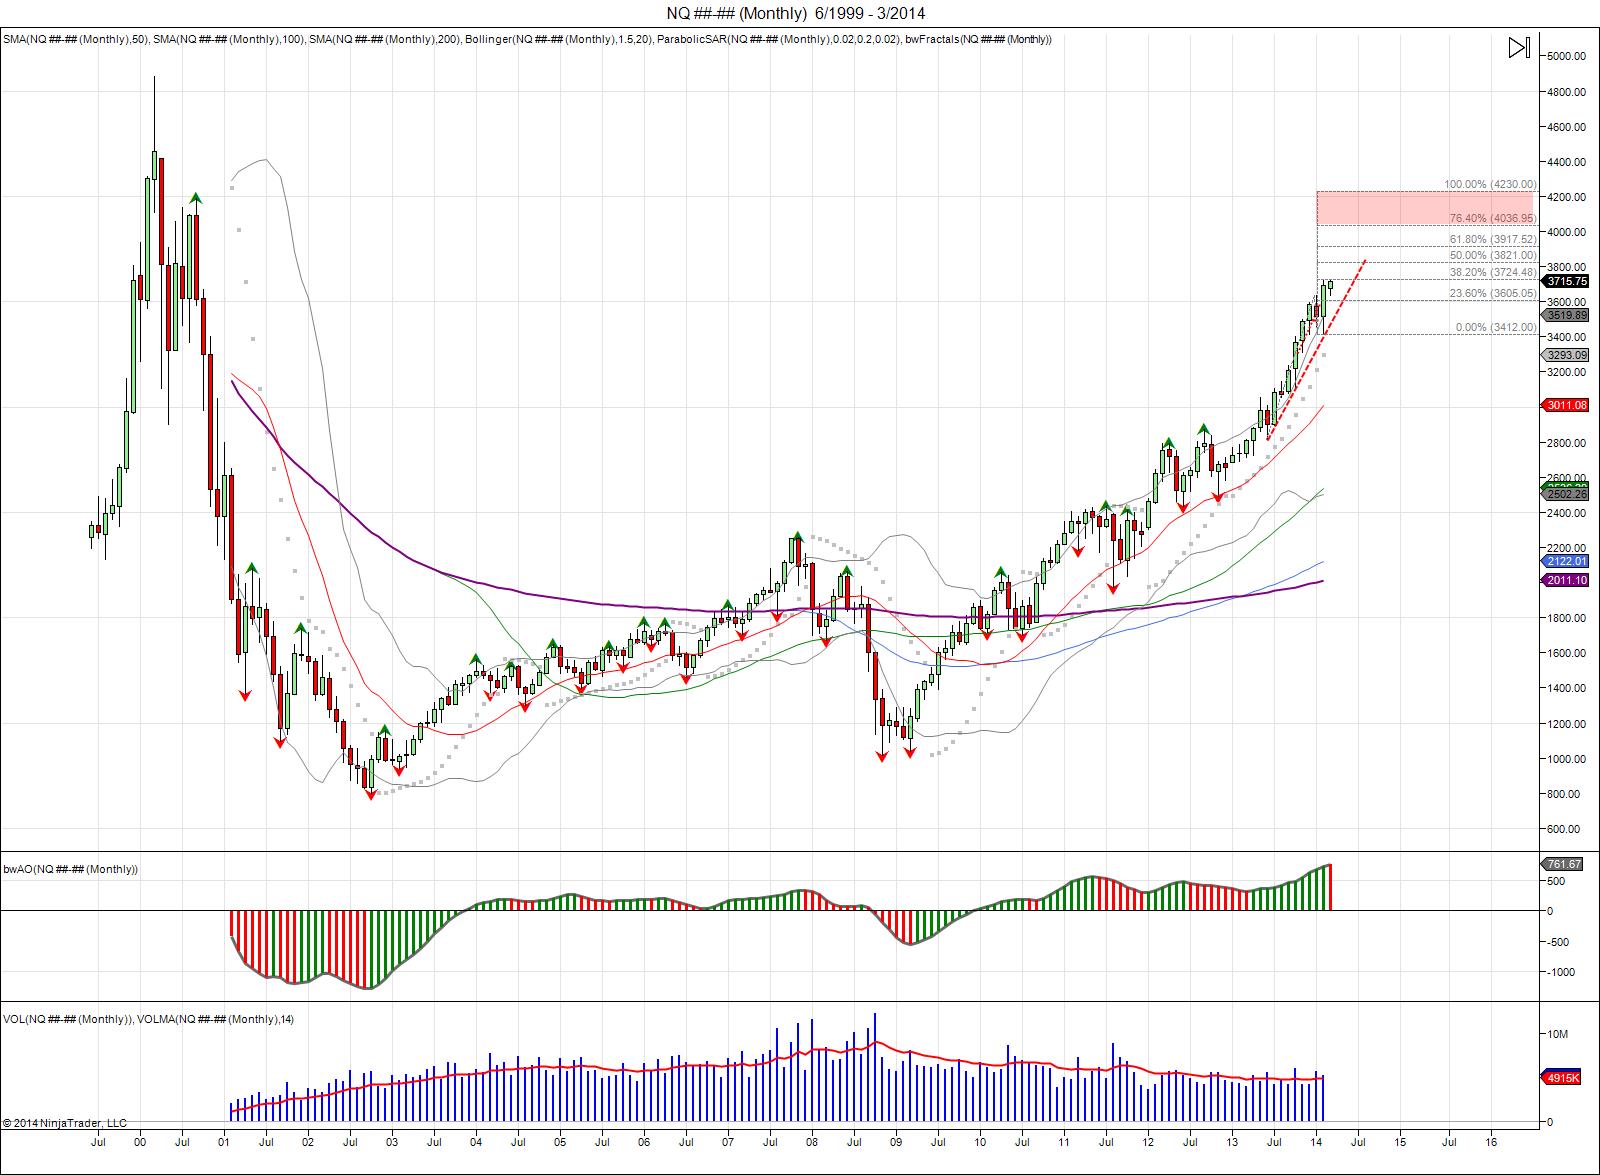
Nasdaq futures are staging the ultimate retest as the market is now 500 points from testing major resistance of where the market failed during the dot com bubble. By taking the low of the last major correction at 281775 (May 2013), using the January high of 362525, and the last recent low of 3412 made February of this year as the market’s attempted to breakdown only to fail, this gives upside fib extension levels of where the market can lead to. Thus far we have seen the market extend 38.2% at 3724, being where and what the market is working on now. Continuation of holding above the early 2014 high of 3635, this gives room to continue the squeeze higher as shorts capitulate. A 50% fib extension is met at 3821, followed by 3858 to complete the range expansion from 3635-3412 up to 3858. MAJOR resistance is met within 3900-4230 as the top level of the fib extension, being a 100% extension of the failed breakdown this year from last year’s move up. The first test of this range, should be sold with both hands forward, as this is the first test of the dot com bubble.
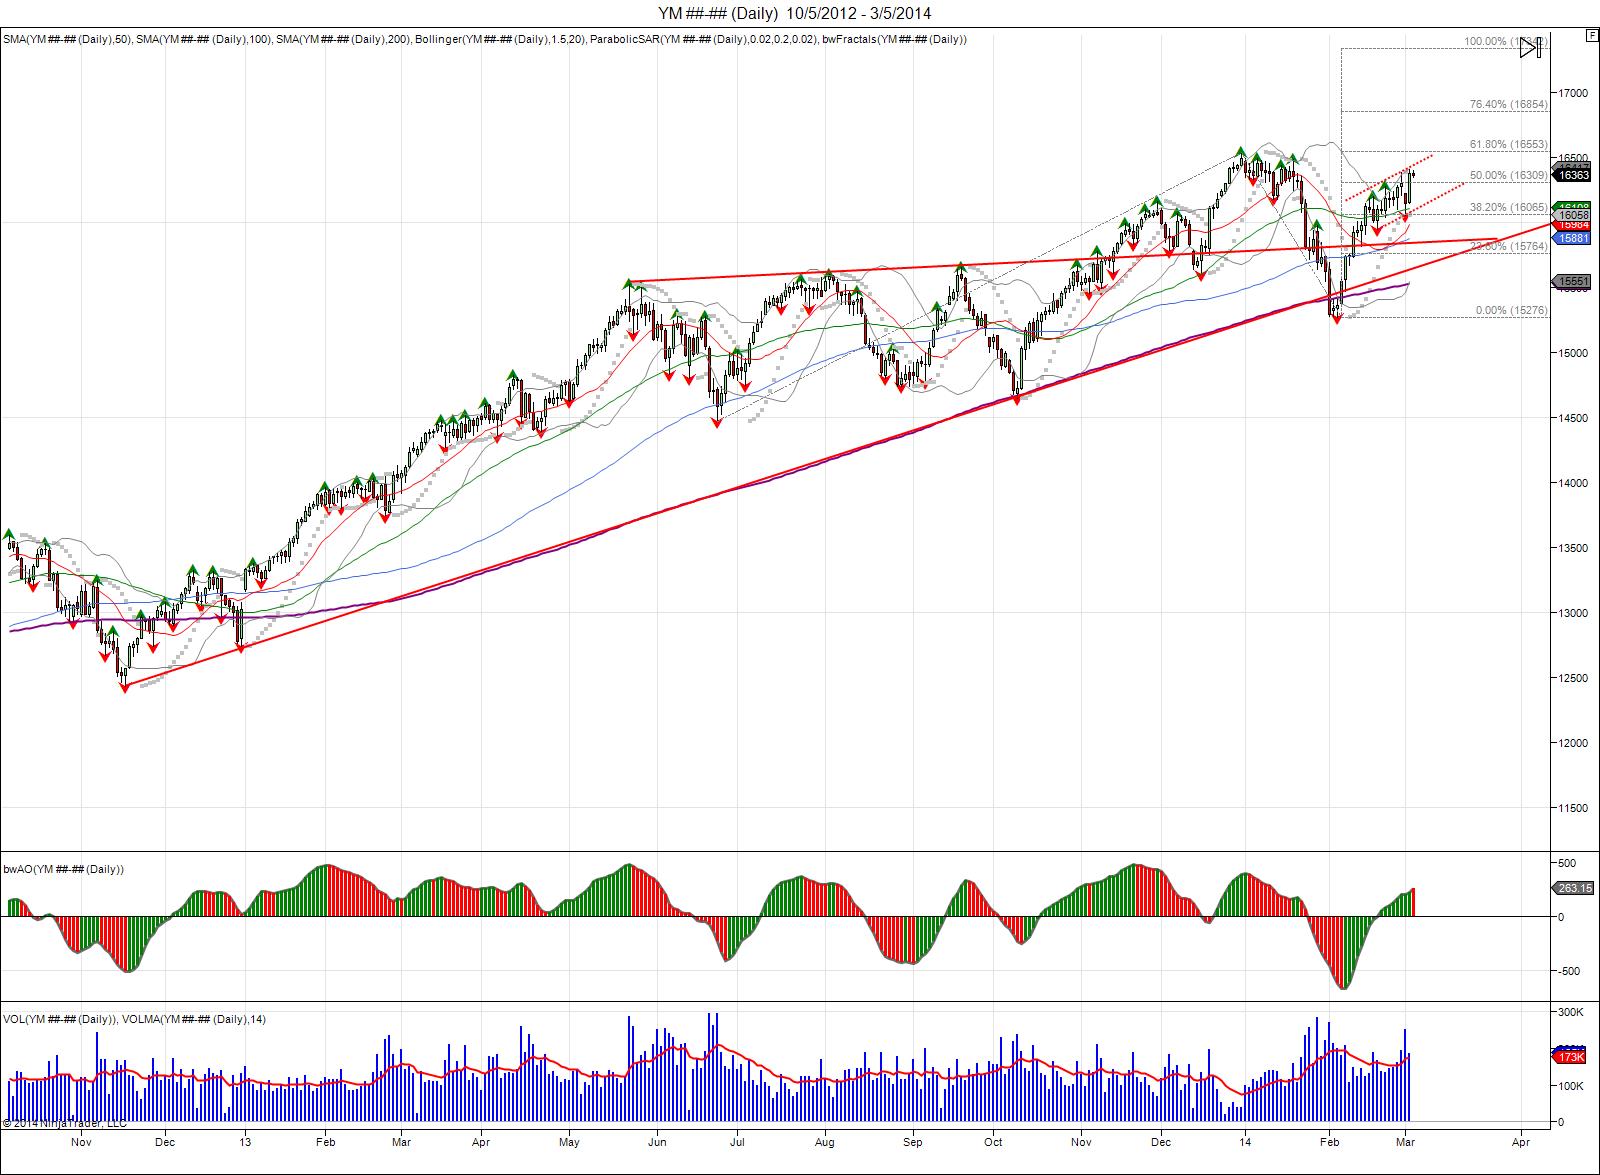
The Dow Jones average bounced off a major trend line as it attempted to break this year, only to turn into a head fake and recover back above 16000. Taking the low from last June to the high made in December down to this most recent low, we have seen the market recover to chip away against major resistance at its 50% fib level of 16309. This has led into the creation of a small upward channel that sees a 61.8% extension at 16553 to match the highs, followed by 16854 as 76.4% fib and ultimately 17342 as 100% fib extension.
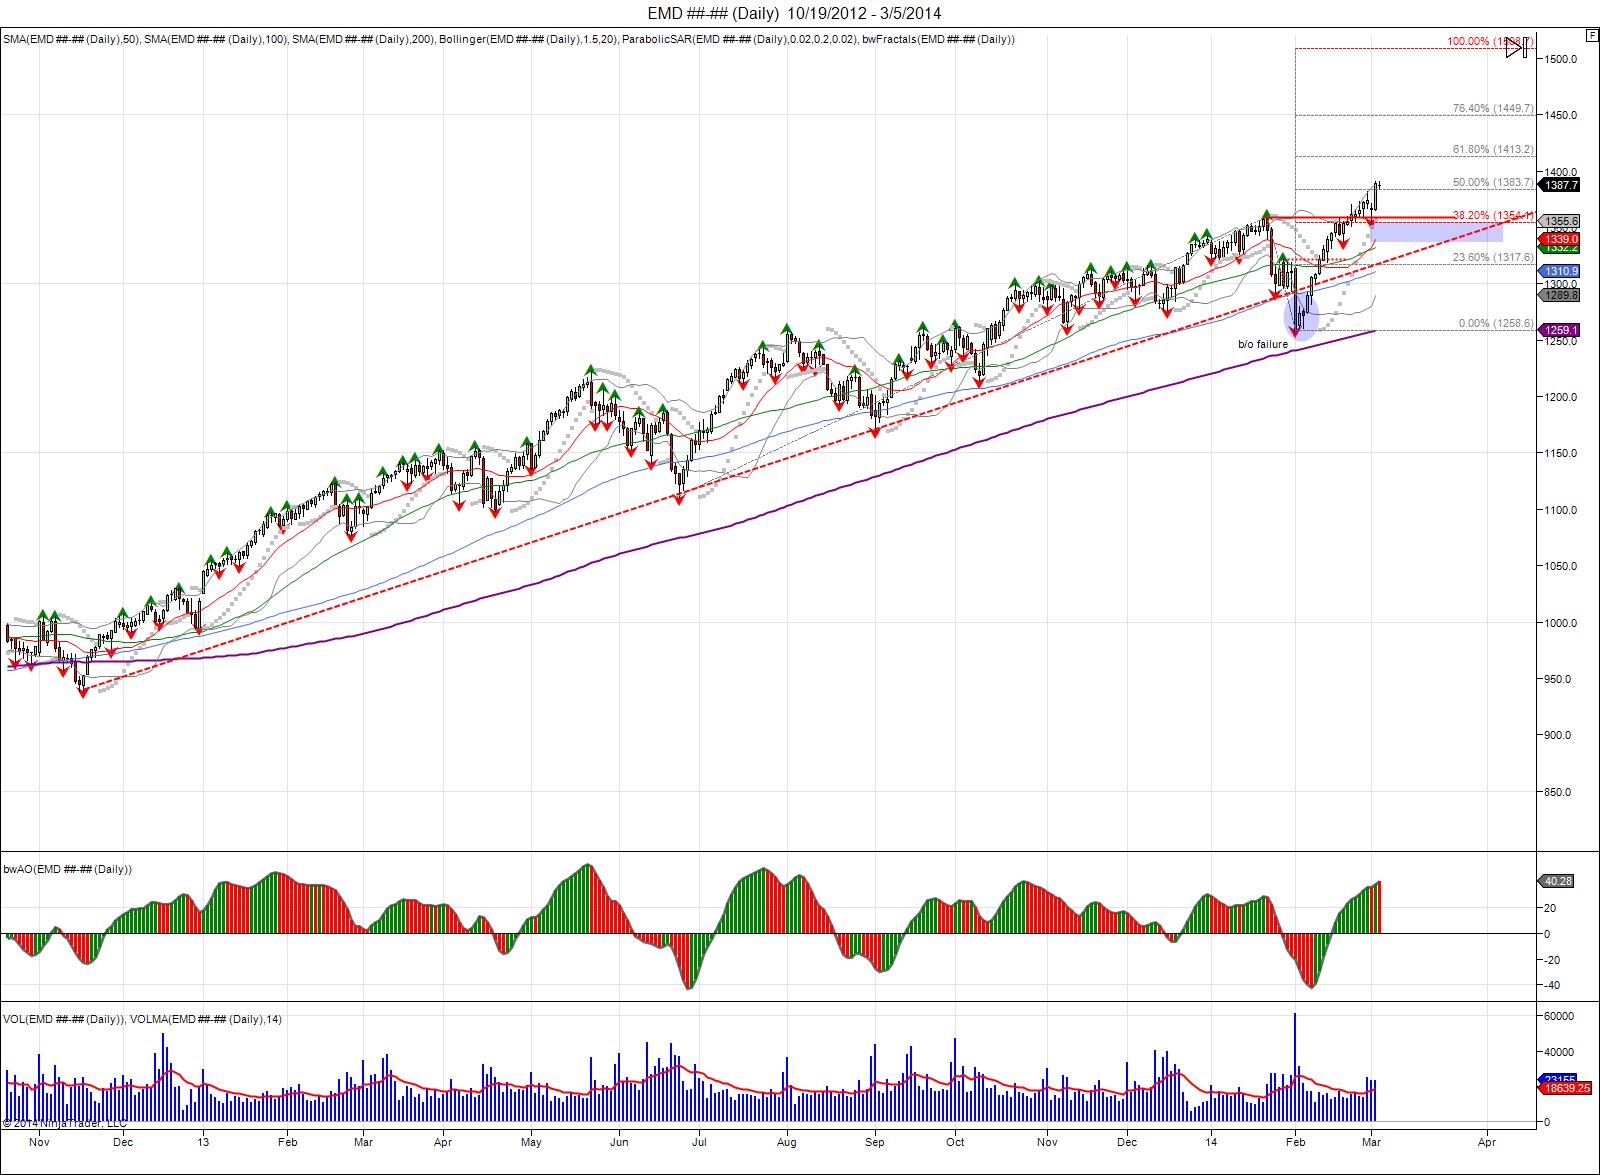
The Midcap index shows a similar picture. With the breakdown in 2014 taking out the 2013 trend line, this too turned into a failed breakdown and a head fake as the market did a V shaped reversal to reclaim the failed 2014 highs. By reclaiming highs with the V reversal, the market squeezed shorts that came in on the breakdown. By holding above the highs, it shows not only did it reverse, however it is finding and forcing new buyers to stabilize the market at the old highs in attempt to build a base for the V reversal. This has led into hitting resistance at the 50% fib extension at 1383.7. If buyers can sustain the market above the January highs, taking the range from the January high to February low gives room to expand the range up to 1461.8, meeting its 76.4% fib extension. Support for this trend seen within 1355-1335 with major support down to 1315. Failure to hold above 1315 and breach of the February lows is the line in the sand for this capitulation attempt to the upside.
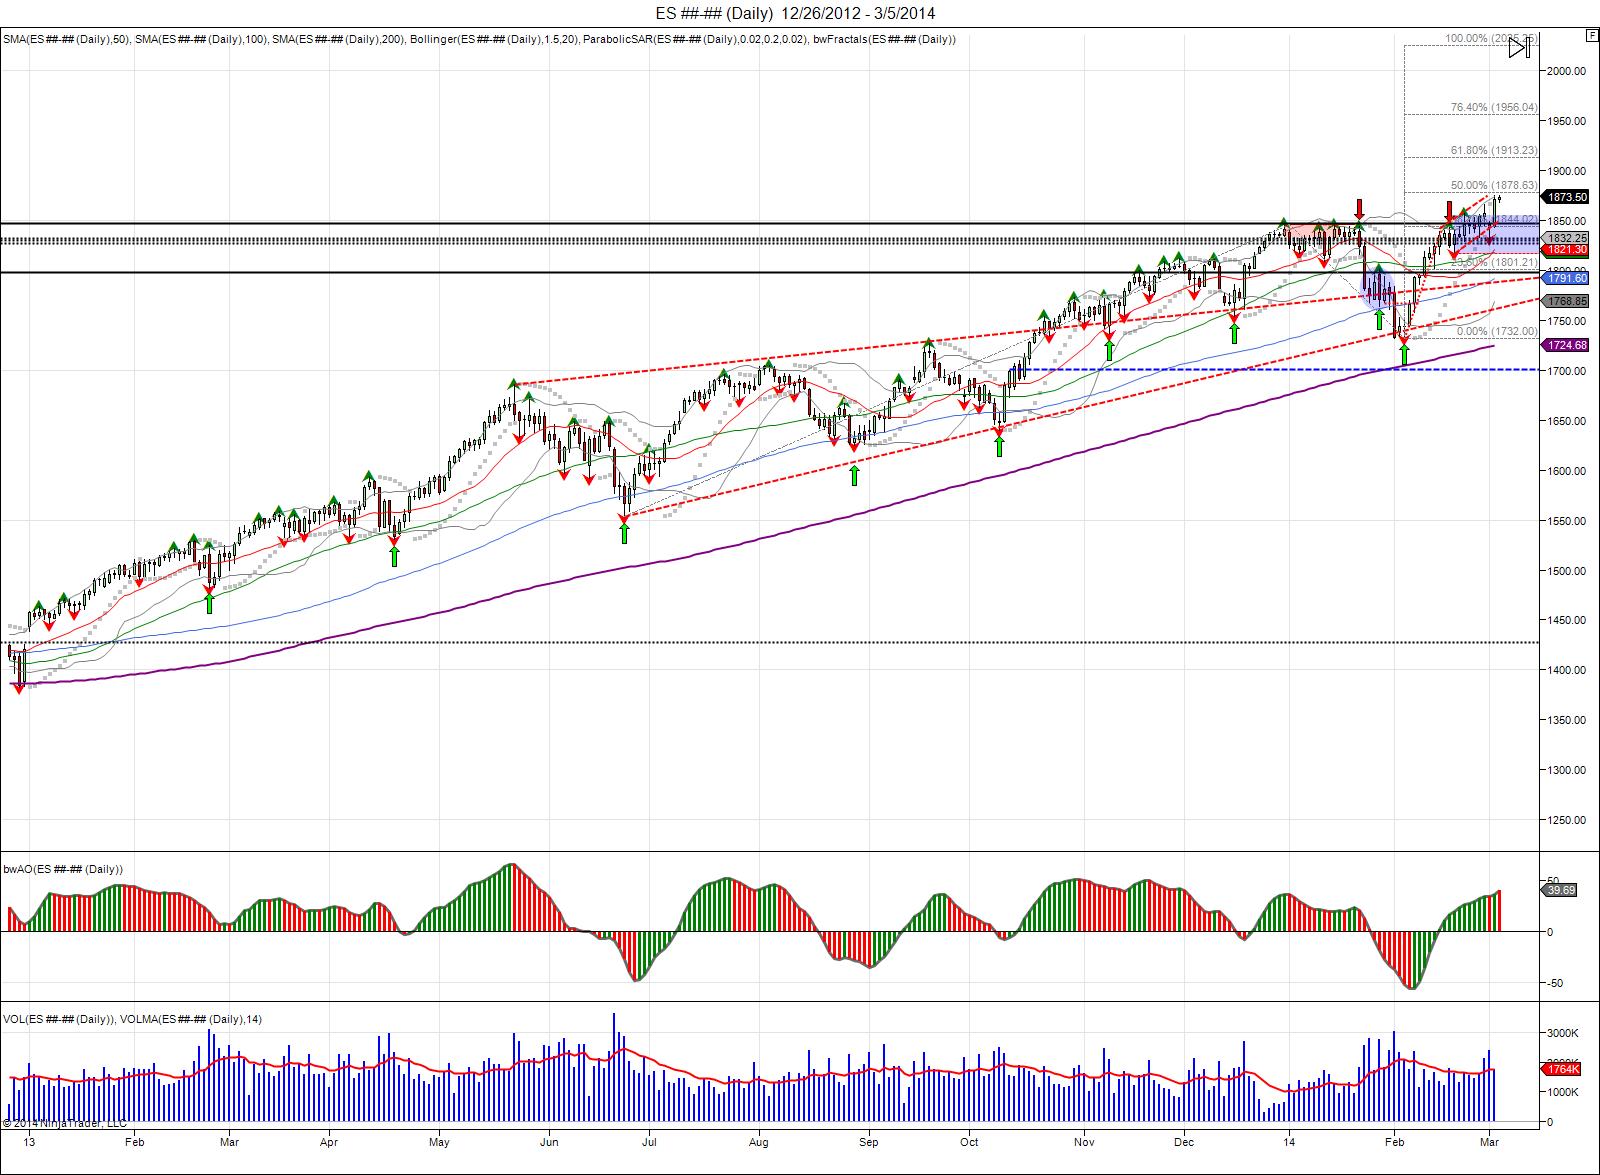
Last but not least, the SP500 index. As seen in the daily charts, since the 2013 gap and go, the SP500 has successfully held higher lows and made higher highs as it has continued to force buyers to chase the market up. November saw the market break above its daily pennant, which led to highs of 184650 going into the close of 2013. To start 2014, these highs failed to be taken out, seeing the market pull back into retesting the breakout point of the pennant. This saw the market bounce off the bottom end of its trendline from the 2013 lows with new lows in 2014 at 1732. This also turned into a failed breakdown as a new low for 2014 was made by a tick before seeing a violent reversal back up to reclaim the 2014 highs. Since reclaiming this high and following the V reversal to squeeze shorts, the SP has traded sideways in attempt to consolidate and build a base as it works against major resistance against 1847. The longer the market trades sideways, the more of a base it builds for new buyers to come in after the V reversal and defend the market to build this base for a launching pad for a new leg higher. Taking the range of 184650-173200, gives an upside target of 1961 if buyers can sustain and expand the market above the old 184650 highs. 6 daily closes above 1847 reverses the bearish bias established under 1797 to give room for this expansion. The highs made late December were done on the last day of the trading year as shorts threw their towels in. With the breakdown this year, this caught many short once again, giving fuel for the reversal back to the highs. We saw a violent recovery back up, and this is what takes place when markets fight to hold and or change trends is the moves become more violent as war takes place between buyers and sellers. For a capitulation to take place, and to expand the 2014 range, this gives room up to extending 61.8% at 1913 followed by a 76.4% fib extension of 1966. This is the markets attempt to blow off a top, and to develop a capitulation of shorts and massive hysteria by longs, we need to see big up days of 2-3% done on strong volume. New support within 1840-1817. Failure to hold 1817 gives room down to retest 1800 with 1732 as the line in the sand for the long side.
RISK DISCLOSURE: PAST PERFORMANCE IS NOT INDICATIVE OF FUTURE RESULTS. THE RISK OF LOSS IN TRADING FUTURES AND OPTIONS IS SUBSTANTIAL AND SUCH INVESTING IS NOT SUITABLE FOR ALL INVESTORS. AN INVESTOR COULD LOSE MORE THAN THE INITIAL INVESTMENT.