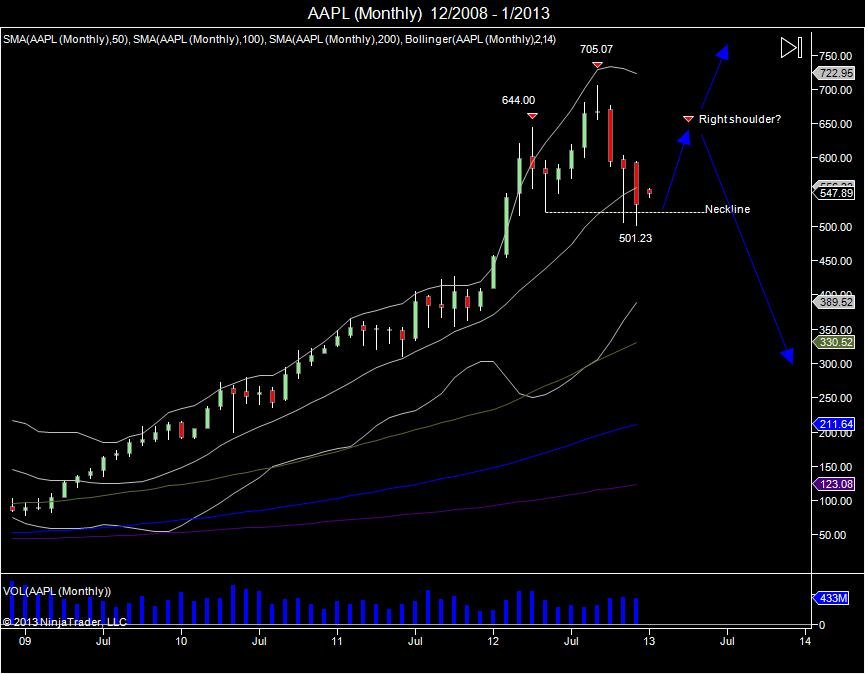
Since putting in highs of 705.07 as the iPhone 5 was announced in September of 2012, doubling from the August 2011 lows of 350, Apple saw a reversal in October that broke the September lows of 656. This turned into a major failure and sell the news catalyst as the market quickly reversed lower. This reversal led the market to fall into its 100day moving average on the daily chart, making lows of 623.55 to test where the market broke out in August. Just as the market was on these lows at 623, Apple bulls were relentless in thinking to just buy the dip. An Apple event was scheduled for October 23 that had these bulls giddy for a move higher. Warning about how this event was what the bulls were hanging their hopes on, a mini ipad.
Apple event just what the bulls have their last hopes on to save this market... a mini ipad.
— Chicagostock Trading (@Chicagostock) October 16, 2012
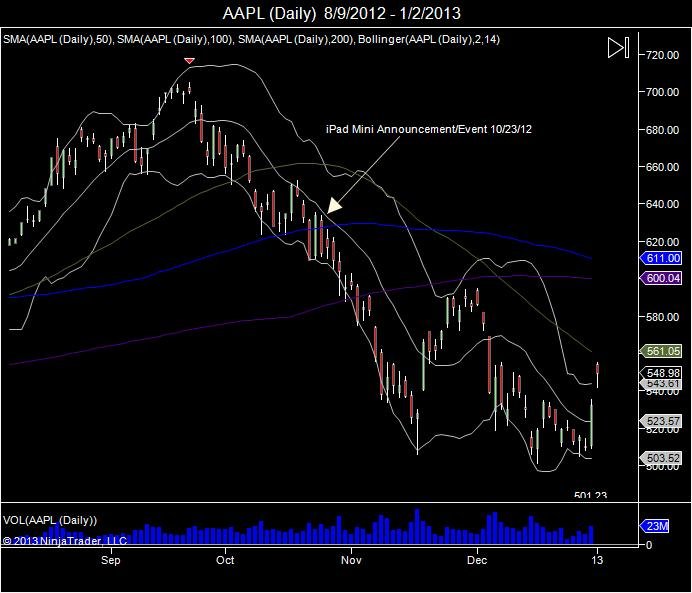
Sure enough as the mini iPad was announced on October 23rd, the market closed that day at 613.36, below the 620 level. The move that followed was the market's way of squeezing out late and complacent bulls as the market targeted the pivot low of 522.18 set in May, just before seeing the squeeze into 705. When this target was mentioned, it was deemed impossible and crazy.
$AAPL targets 522 and room down to 350. #retrace
— Chicagostock Trading (@Chicagostock) October 22, 2012
Ofcourse the reasoning for this was to do the impossible and bring the most pain to traders. A lot of traders missed the boat from the August breakout of 620 into 705 as this was done during the summer trading period of 2012. When the market fell back to 620 it was "time to buy" for these traders. They did not want to be left out again. Except the market did not spare any pity as it offered NO uptick to allow these dip buyers oppurtunity to protect and or take profits, driving the market straight toward the 520 level to squeeze out these buyers and frustrate the community. Sure enough as the 520 target was initially broken in November, this led to a short squeeze and short covering rally seeing the market put in highs of 594.59 early December. Making the first two green weekly bars since the 705 highs. Since this December high the market came back to retest the 520 level. The November low of 505.75 was taken out with a new low of 501.23 to shake out the market, consolidate prices at this level and put in the potential for a double bottom. With the market below the 520 level, the 14 day moving average crossed the 50day moving average to signal a "deathcross". This lagging indicator has made people nervous about owning the stock now as it looks to be on the edge of a cliff. Any time the market makes a higher high and falls down to take out the pivot low prior to that higher high, we look for stabalization, to attempt to build a neckline for a larger head/shoulder pattern. At this point we know the clearly defined neckline is the 501.23 level. Longs who came in late over the past few months have been shaken out. New money is trying at these levels to attempt a squeeze higher to retest where the market failed. It is a new year and a new quarter and Apple is expected to report earnings later this month. This gives the catalyst to see the market attempt to rise from this neckline and see this retest. Upside resistance is now met against 650 as it offers the level from the September range of where the market failed. Should the market see a move to this level, it offers buyers who have been in this in the long term an oppurtunity to seek protection and or trim longs. Having gone through a $200 rollercoaster ride down off the highs, a $150 point move back up should be taken as a gift. The market will have to move through the September range to regain the bullish momentum. Topping attempts take time to build. They create a failed higher high followed by a reversal that takes out the pivot that led into that higher high. Thereafter a retest of the failed range gives oppurtunity to show strength and or falter. Failure to break through the September range gives the oppurtunity to build a right shoulder on the monthly chart and target the 501.23 neckline again to confirm a head/shoulder topping pattern. With this a breach of the neckline then gives room to expand the range of 705-501 below 501 giving a target of 297.
RISK DISCLOSURE: PAST PERFORMANCE IS NOT INDICATIVE OF FUTURE RESULTS. THE RISK OF LOSS IN TRADING FUTURES AND OPTIONS IS SUBSTANTIAL AND SUCH INVESTING IS NOT SUITABLE FOR ALL INVESTORS. AN INVESTOR COULD LOSE MORE THAN THE INITIAL INVESTMENT.