(click chart to enlarge)
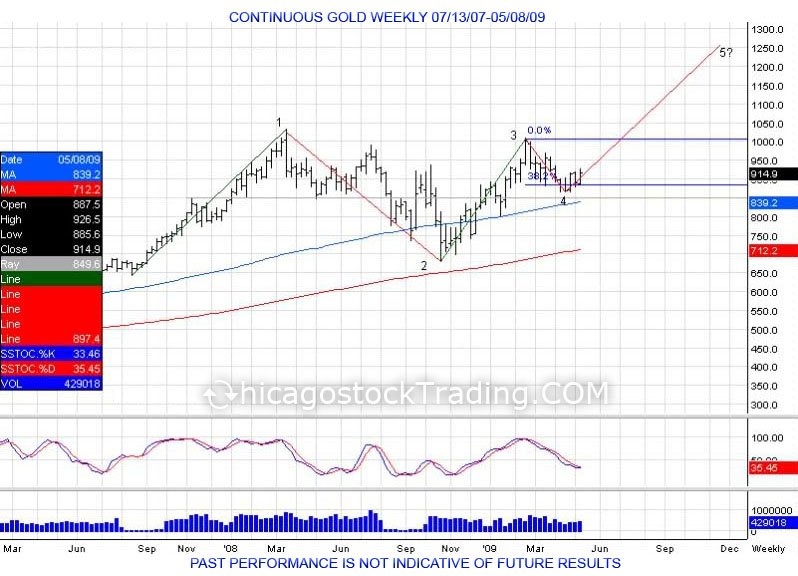
Gold in 2008 was the first time the market breached the $1000 mark, hitting highs of 1033.9 in March just as the Federal Reserve Bank of New York provided an emergency loan to Bear Stearns to keep the company solvent from it's bets in subprime mortgages. This was followed by a correction and liquidation in the fall just as the equity markets began to crash in September. The panic and liquidation selling led gold to fall into lows of 681 in October before retreating back to retest the $1000 mark in February of 2009. This created an Elliot Wave pattern that saw the first wave 651-1033, second wave being the corrective wave from 1033-681, third wave being the move back up from 681-1007, fourth wave which was a very small 38.2% correction of the 3rd wave, setting up for the fifth wave to try and continue higher.
(click chart to enlarge)
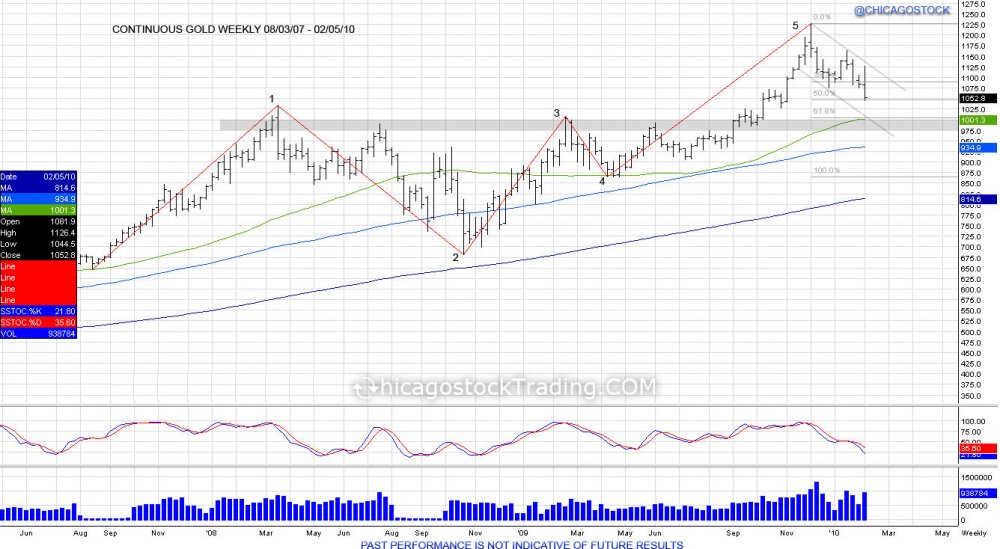
The fifth wave completed with gold moving from 865-1227.5 just as the Federal Reserve bank lowered their federal funds target rate to 0% in January of 2009. This gave gold the fuel to move back through $1000 and continue this 5th buying wave to take out the old $1033.9 highs. Showing gold's strength and proving naysayers who did not see gold breaching over $1000 again wrong. As the 5th wave completed with highs of 1227.5, this led to profit taking and a small correction as gold corrected 50% of the 865-1227.5 move as well as coming back to retest the old 1033.9 highs with the gold making a low of 1044.5 in February of 2010.
(click chart to enlarge)
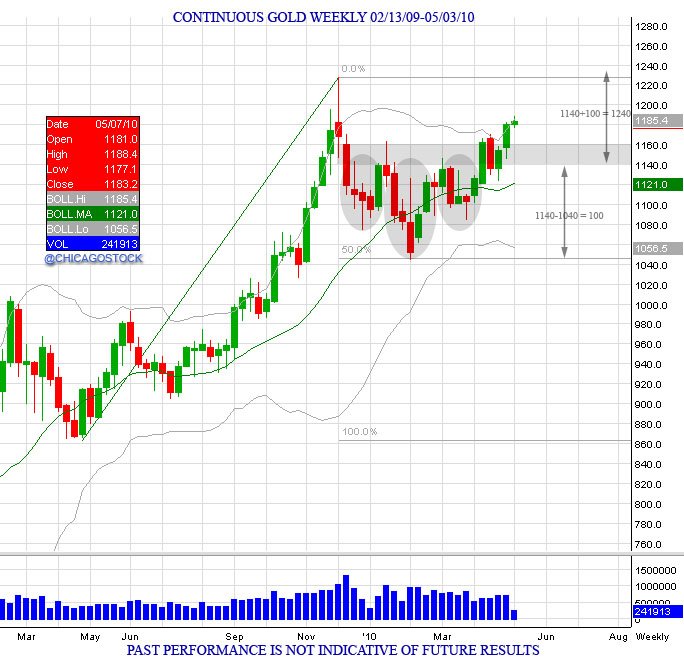
The correction from 1227.9 into 1044.5 led into 4 months of consolidation as gold worked on building a base, in turn developing an inverted head/shoulder bottoming pattern against the 1044.5 low. This pattern and range of 100 (1140-1040), gave an upside target of 1240 with the market breaking through 1140.
(click chart to enlarge)
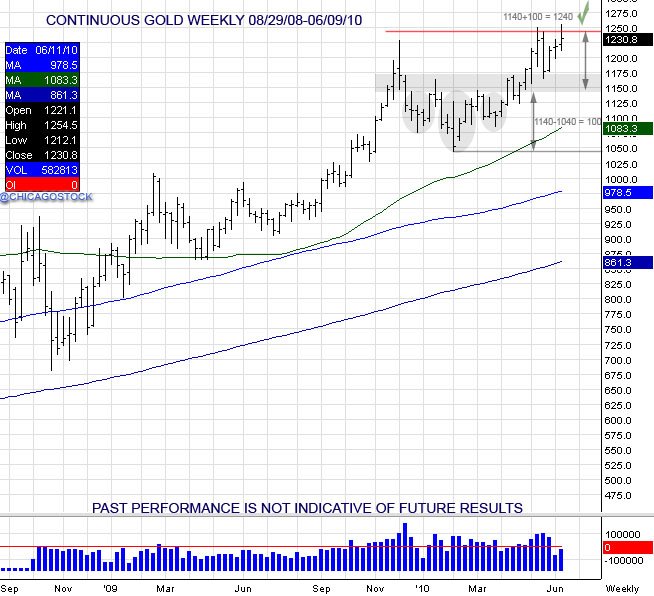
In May of 2010, the target of 1240 completed after the market broke through 1140 in April. This led to another small correction down to retest where the market broke out at 1140 with lows of 1155.6 in July of 2010. Finding new support at old resistance, gold continued higher into highs of 1432.5 in December of 2010.
(click chart to enlarge)
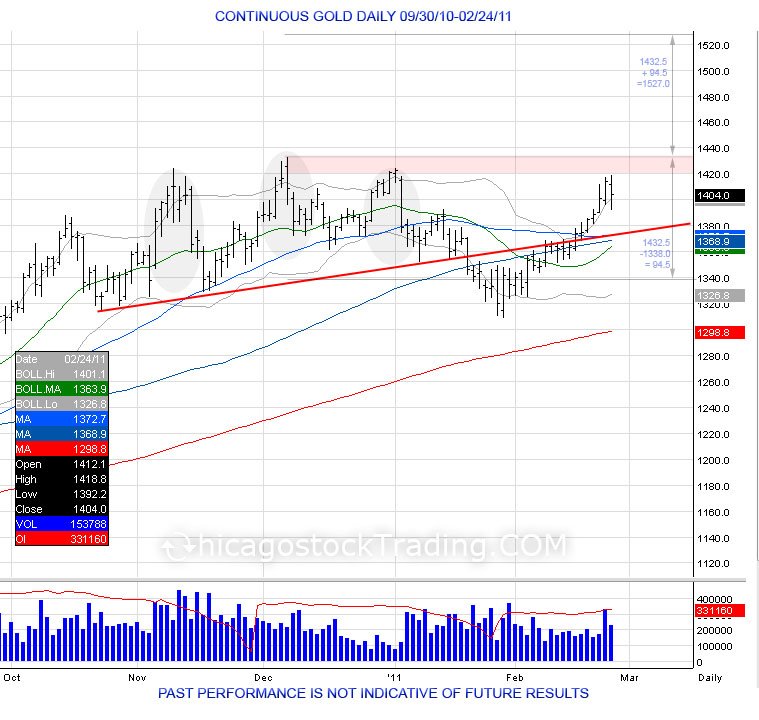
With gold making new record highs of 1432.5 in December of 2010, this led into another consolidation period in which sellers attempted to top the market by developing a head/shoulder pattern. The neckline was breached in January of 2011 as gold traded down to 1309.1. This turned into a failed breakdown and a head fake as gold recovered back above its neckline to target the "head" of 1432.5 made in December. By taking this range of 94.5 (1432.5-1338), this gave gold a new upside target of 1527 with a breach through 1432.5 by using sellers within that failed head/shoulder topping pattern as fuel for the upside move.
(click chart to enlarge)
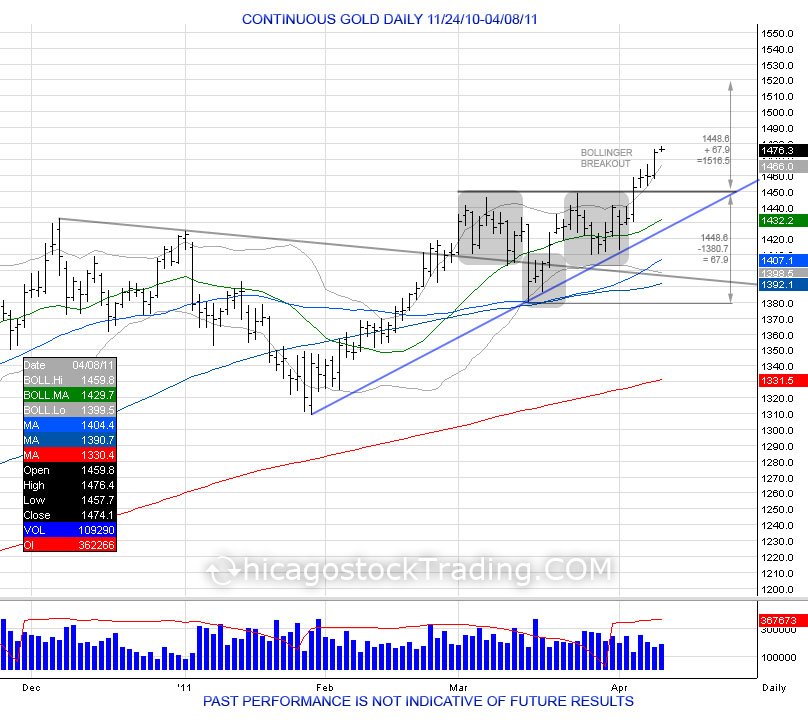
This attempt to break out into 1500 did not come so easily. After taking out 1432.5 and proving sellers to be wrong, gold went through another consolidation period in attempt to build a base. This developed an inverted head/shoulder pattern after gold dropped to 1380.7 in March of 2011 before recovering to take out the previous high of 1445.7 made earlier in the month, to create another failed breakdown and trap of shorts with the 1380.7 attempted breakdown. This low was retested later in the month as gold held at 1410.1, in turn developing the right shoulder for the inverted head/shoulder bottoming pattern as the market tested and defended the 1380.7 "head". This consolidation period developed a new range of 67.9 (1448.6-1380.7) which gave an upside target of 1516.5 on a breach of the neckline 1448.6.
(click chart to enlarge)
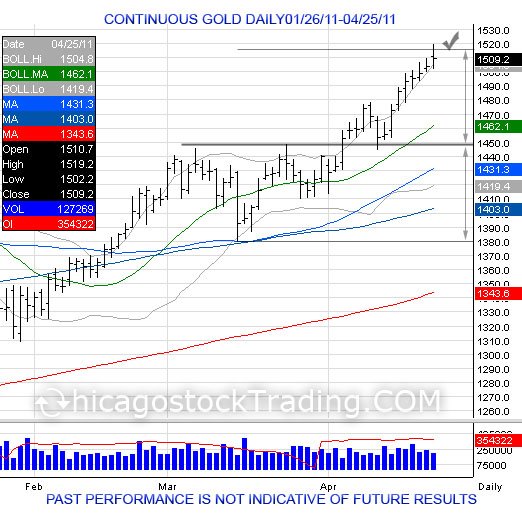
On April 25th of 2011, gold completed it's upside objective of 1516.5 by taking the range of 67.9 (1448.6-1380.7) and expanding it above 1448.6. Highs of 1519.2 were made.
(click chart to enlarge)
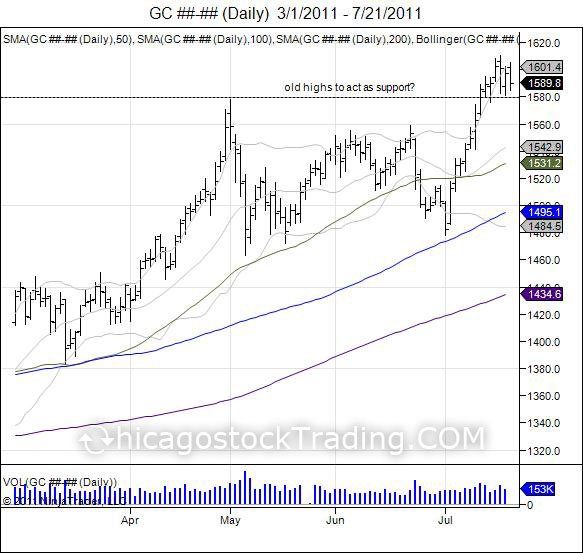
Following the completion of this new upside objective at 1516, gold did not stop. The market made new highs of 1577.4 in May of 2011 before falling down into lows of 1462.5 just days later on May 5th of 2011. This created a new period of consolidation as gold retested its old resistance for new support, trading in a range of 1480-1560 for 2 months before seeing another failed breakdown and head fake at 1478.3 on July 1st of 2011. With this attempted breakdown failing to take out the May low of 1462.5, it turned into another head fake as the market bounced higher to take out the previous high in May and attempt to build a base at these new highs to turn 1580s into new support.
(click chart to enlarge)
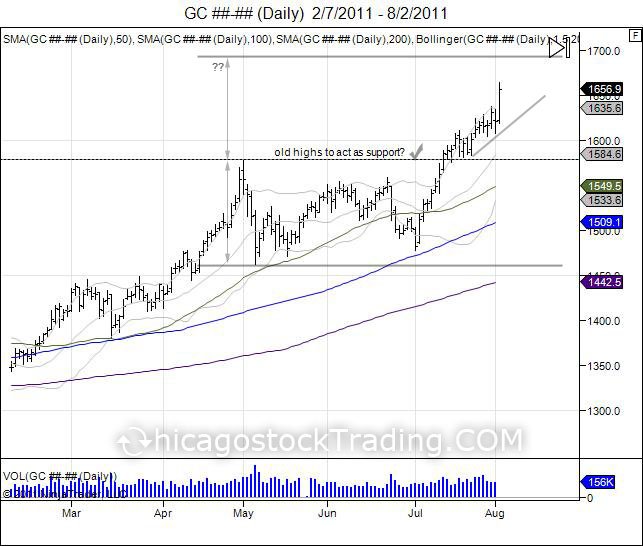
By turning 1580s into new support, gold took the range of 114.9 (1577.4-1462.5) and attempted to expand it higher with a new upside target of 1692.3 (1577.4+114.9).
(click chart to enlarge)
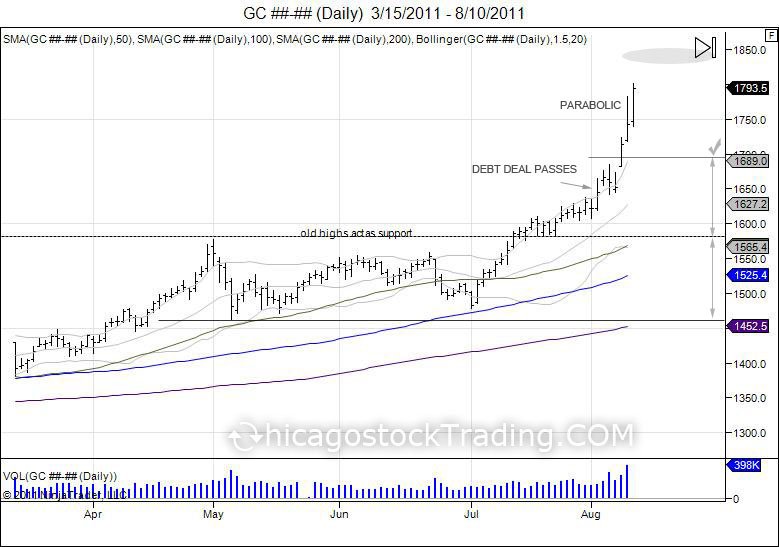
Gold completed its upside objective of 1692.3 in August of 2011 as the market hit highs of 1723.4. This was fueled with the "debt deal" passing that led gold to breakout on the 8th and leave a gap open from the 5th at 1651.8, setting up the "gap and go" breakout. With the 1692 target in gold completed, this is when the market went "parabolic".
(click chart to enlarge)
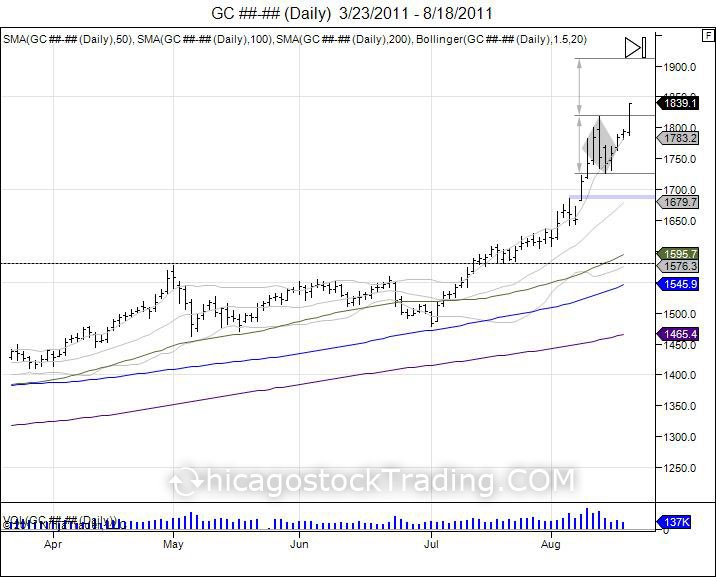
This parabolic move led to highs of 1817.6 on August 11th before correcting down to 1725.8 the following day. A huge and wild reversal off the highs that gave shorts an idea that the "top" was in. Only this range of 91.8 (1817.6-1725.8) gave an upside targe tof 1909.4 (1817.6+91.8) by using the shorts who came inside of this range as fuel for the upside squeeze by breaking above 1817.6 and expanding the range of 91.8 higher, giving the new target of 1909.4.
(click chart to enlarge)
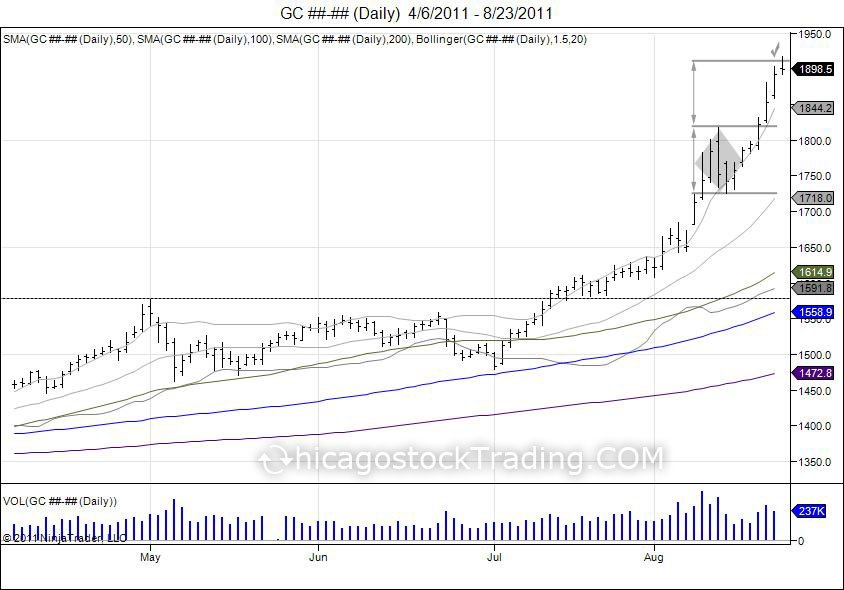
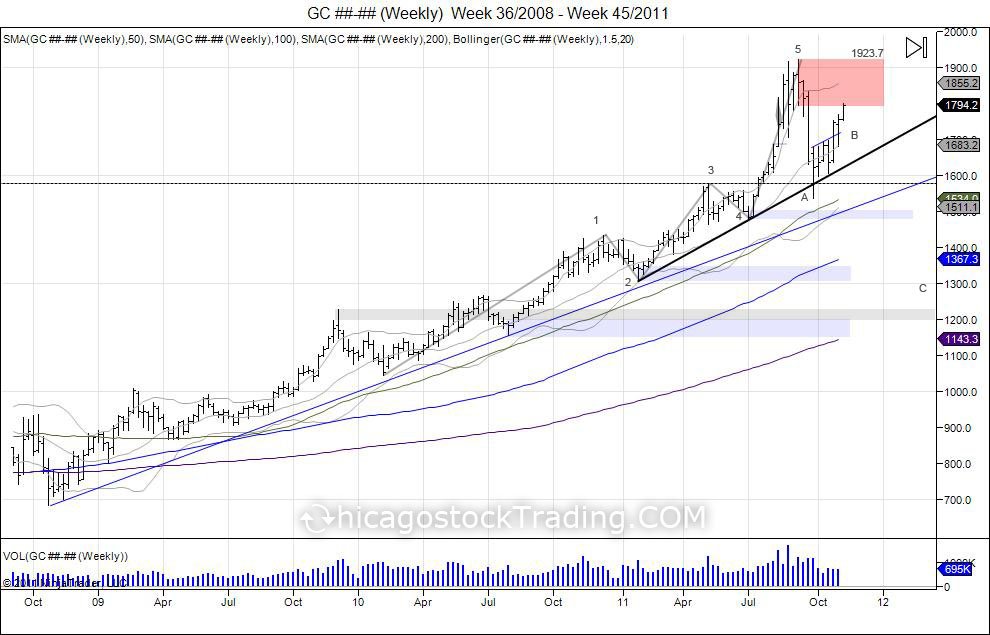
On August 23 of 2011, gold completed its new objective of 1909 with highs of 1917.9. This led into another wild swing and correction down to 1705.4 just 2 days later on the 25th before pivoting back to squeeze out the 1917.9 high into new highs of 1923.7, taking out new sellers attempting to defend that 1917.9 high. This created a double top as gold failed to hold above the old 1917.9 highs and turned lower to break the pivot low of 1705.4 made on August 25th.
(click chart to enlarge)
The correction led the market to fall into lows of 1535 on September 26th, hitting a long term trend line from the 1300 lows earlier in 2011. The correction popped the "parabolic" bubble, creating that old range of 1705-1923.7 into new resistance.
(click chart to enlarge)
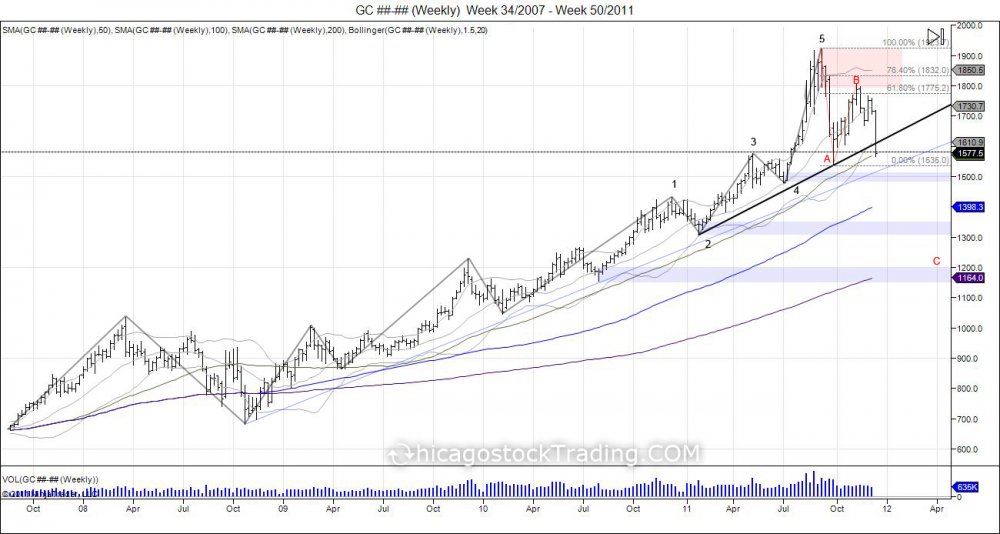
As gold bounced to retest this resistance from the "parabolic" move of 1700-1900, gold printed highs of 1804.4 on November 8th, 2011, before falling down to take out the September low of 1535 into new lows of 1523.9 on December 29th of 2011.
(click chart to enlarge)
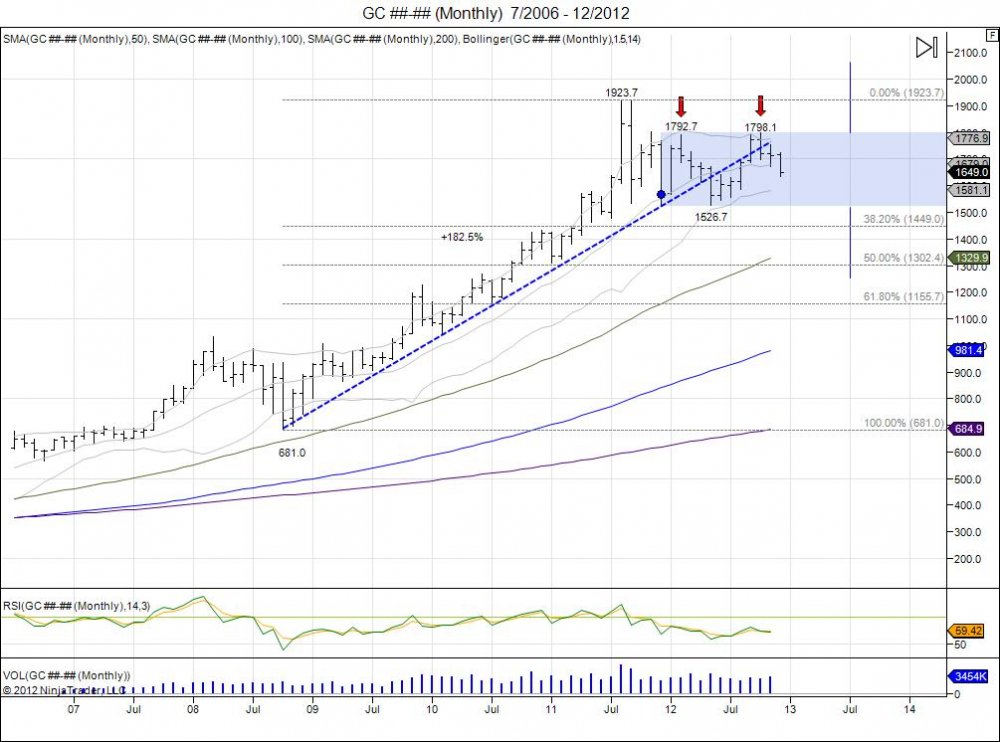
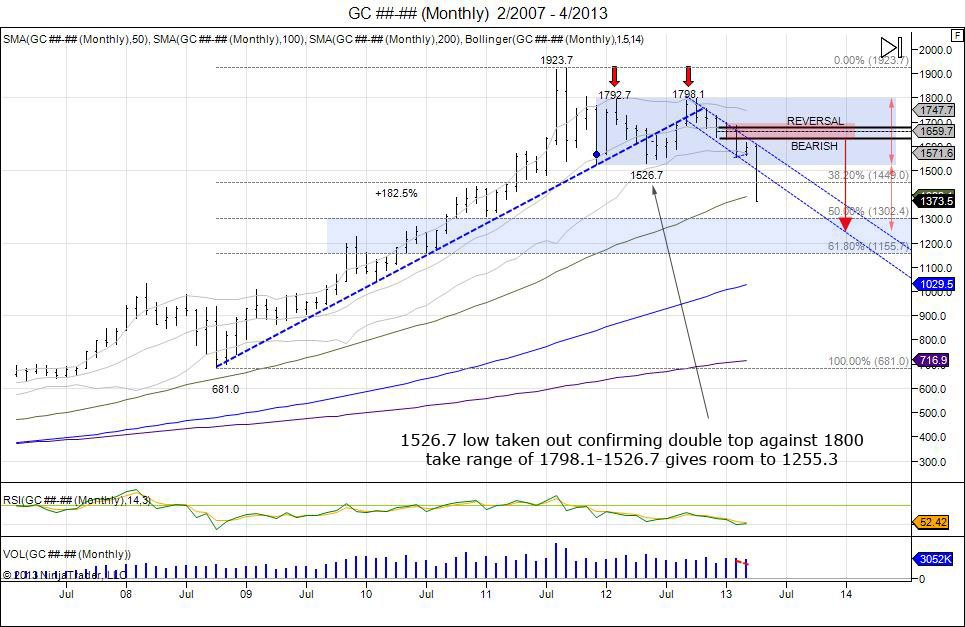
After breaching 1000 and running up for two years, gold's parabolic action in 2011 was fueled by shorts being squeezed out and late buyers piling in, highs of 1923.7 were followed by a correction down to 1523.9 just before 2012. A $400 swing from the highs. The year of 2012 turned into one big year of consolidation. Gold retested 1800 early in the year with highs of 1792.7 that failed to push through which was followed by a correction to 1526.7 in May of 2012. Not ready to quite break lower, and once again making it a tough time for short sellers, gold rallied back to the highs of the year. The high of 1792.7 was taken out to stop out shorts with gold hitting 1798.1 in October to once again test the 1800 resistance. The market once again failed to push through, keeping buyers within the "parabolic" period of 1700-1900 trapped. This led into a pullback down to 1672.5 just before December's FOMC statement. On December 12, 2012, the FOMC put an unemployment target of 6.5% for the Fed funds rate. This was the first time after a period of 0% interest rates that fueled gold from 1000-1923.7 that a target was created to "adjust" the interest rates accordingly. Sure enough this was exactly what was needed for gold to go into profit taking as gold bugs got "spooked" by this new target for the fed funds rate.
 (click chart to enlarge)
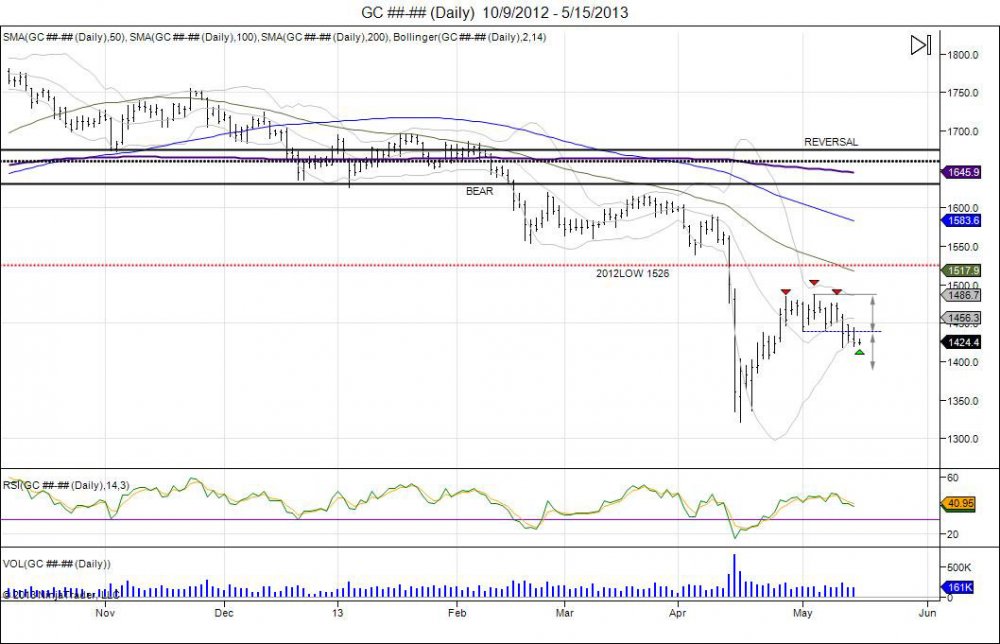
In January of 2013 gold started strong only to round out a top at 1697.8 on the 17th of January before falling down to take out the January lows of 1626, giving room to target the 2012 low of 1526.
(click chart to enlarge)
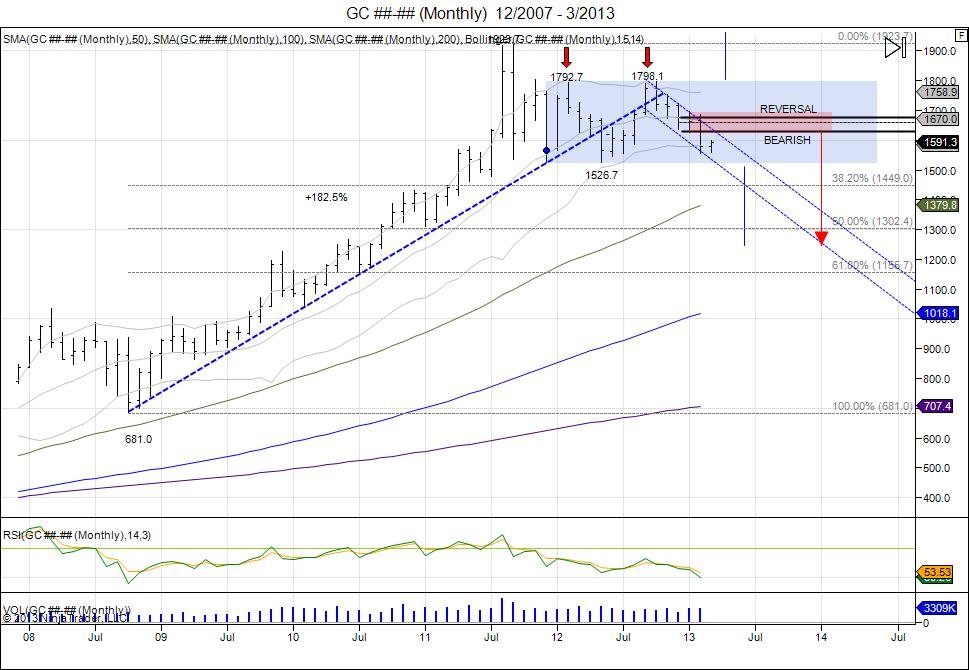
After taking out the early 2013 low of 1626, gold went into a consolidation period (bear flag) against the lows as it fought against support from the 2012 lows. On April 12th, gold broke the 2012 low of 1526 confirming the double top in 2012 against 1800. By taking the range of 271.4 (1798.1-1526.7) and expanding it below the broken low of 1526.7, this gave a downside objective of 1255.3.
(click chart to enlarge)
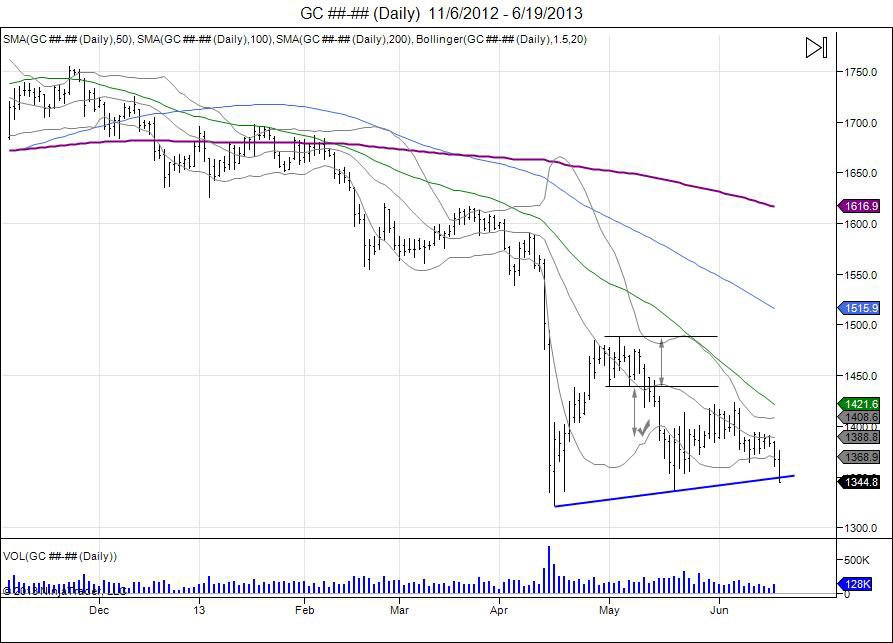
After hitting lows of 1321.5 in April of 2013, gold went into another consolidation period as gold bugs continued to come in and defend the lows, seeing another tug of war take place. This consolidation period led into a head/shoulder topping pattern that gave room to fall back below 1400 after hitting highs of 1423.3 on June 6th.
(click chart to enlarge)
Gold completed this new downside objective by falling back below 1400 and creating an even bigger consolidation period as the weight continued to the downside, developing a "bear flag" pattern. The bear flag was breached on the 20th of June with gold breaking below this consolidation period and shaking out early buyers defending the April low which gave fuel for another sell off to complete the downside objective of 1255.3.
(click chart to enlarge)
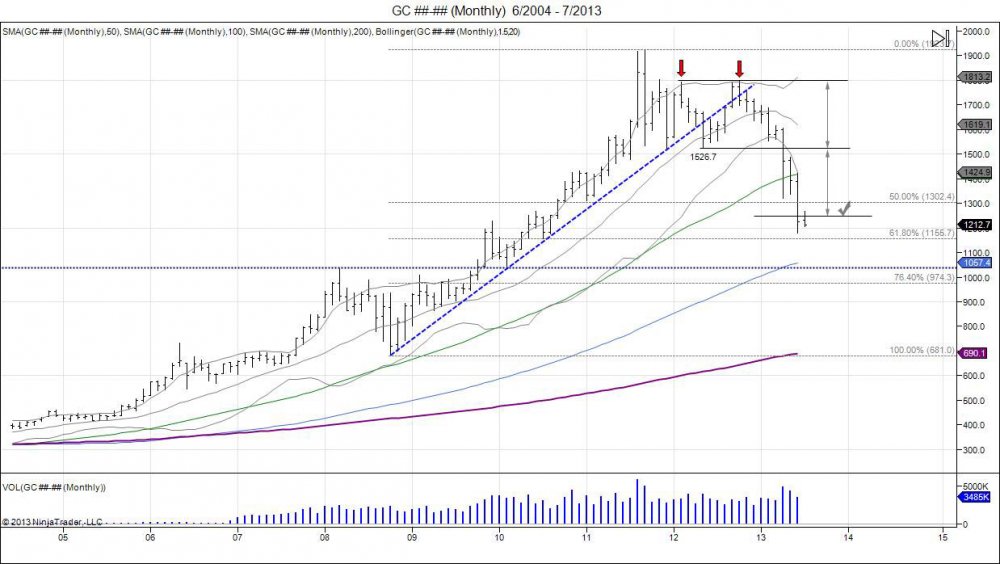
On June 26th, gold completed its downside objective of 1255.3 by falling into lows of 1221. This did not stop selling as panic came into the market and led gold to fall briefly below 1200 and into lows of 1179.4 on the 28th, going into oversold territory after falling an extra 75.9 below 1255.3. This nearly retraced the market 61.8% of the 681-1923.7 bull run and saw a $618.7 correction from the 2012 double top of 1798.1 into these lows of 1179.4. Gold pivoted off these lows into 1267 on the 2nd of July before coming back to retest the panic low of 1179.4, finding support to make lows of 1206.9 on July 5th. The test of 1179.4 turned successful by holding above 1200 and seeing the market march back to take out the 1267 high made July 2nd, turning this in a consolidative "bottoming" attempt.
As >1600 gold was a sell, <1210 is a buy. http://t.co/1BVdCZWDPu
— Chicagostock Trading (@Chicagostock) July 5, 2013
(click chart to enlarge)
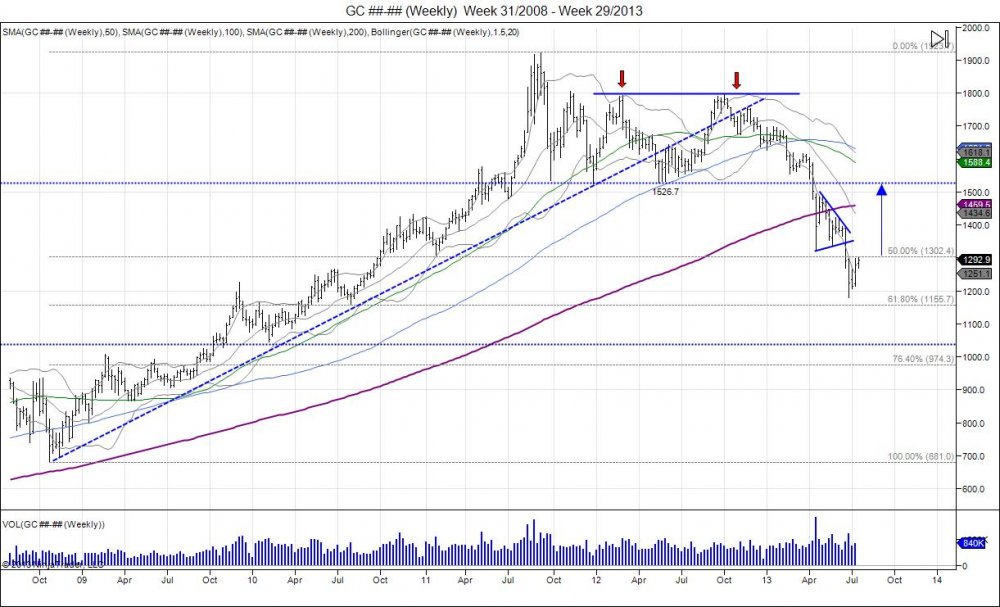
What is next for gold? Gold began the start of this upside leg run after breaking through 1000 on easy fed policy. The market ran up to 1700 before going parabolic into 1900 as shorts capitulated and late buyers piled in through all the infomercials. Stalling in 2012 as it failed to push above 1800, keeping late buyers trapped and luring in new buyers in a big tug of war within 1526-1798.. By falling below this range of 2012, gold shook out buyers within 1526-1800 which gave for the downside target of 1255. With 1255 being completed and even seeing some panic down to 1179.4, gold has "opportunity" to try and retrace higher. Opportunity is emphasized as gold remains in a major short term downward trend, within a LARGER upside trend. After being bearish above 1600, we can be cautiously bullish below 1250. Gold is now testing major resistance at 1300 which is a 50% retracement of the 681-1923.7 move. For gold to hold the recent lows of 1179, small support is seen down to 1267-1257 with sell stops below 1206.9 to give way to re target the 1179.4 lows. Moving above 1300 gives way for gold to test next major resistance at 1348, being the pivot low off the 1376 high it made on June 19th, before flushing down to 1179.4. For gold to turn, gold must recover this high of 1376 to show the move from 1379-1179.4 was a flush and to give way for gold to try and retrace higher back to retesting where it failed from at 1526 from the 2012 lows. This will offer a level for aggressive longs defending these lows an area to take some profits. 1526.7-1923.7 is now a new area of MAJOR resistance for the gold market. To continue the upside bull run higher, this range of 397 (1923.7-1526.7) must be taken out, to give way for a new upside target of 2320.7 (1923.7+397). Failing to hold recent lows of 1179.4 sees the 61.8% retracement of 1155.7 as next major support, followed by 1126 with sell stops below the February 2010 low of 1044.5 that was the pivot low before running into 1923.7, giving way to retest the old highs of 1033.9 as next major support with a breach of the 2008 low of 681 to end the bull run.
RISK DISCLOSURE: PAST PERFORMANCE IS NOT INDICATIVE OF FUTURE RESULTS. THE RISK OF LOSS IN TRADING FUTURES AND OPTIONS IS SUBSTANTIAL AND SUCH INVESTING IS NOT SUITABLE FOR ALL INVESTORS. AN INVESTOR COULD LOSE MORE THAN THE INITIAL INVESTMENT.